If you have a Business Wire Account, log in.
If you need access to your organization’s Business Wire Connect account, please contact your internal account administrator. If your organization does not have an active Business Wire account, sign up."
How to Get Started with NewsTrak Analytics and NewsTrak Reports
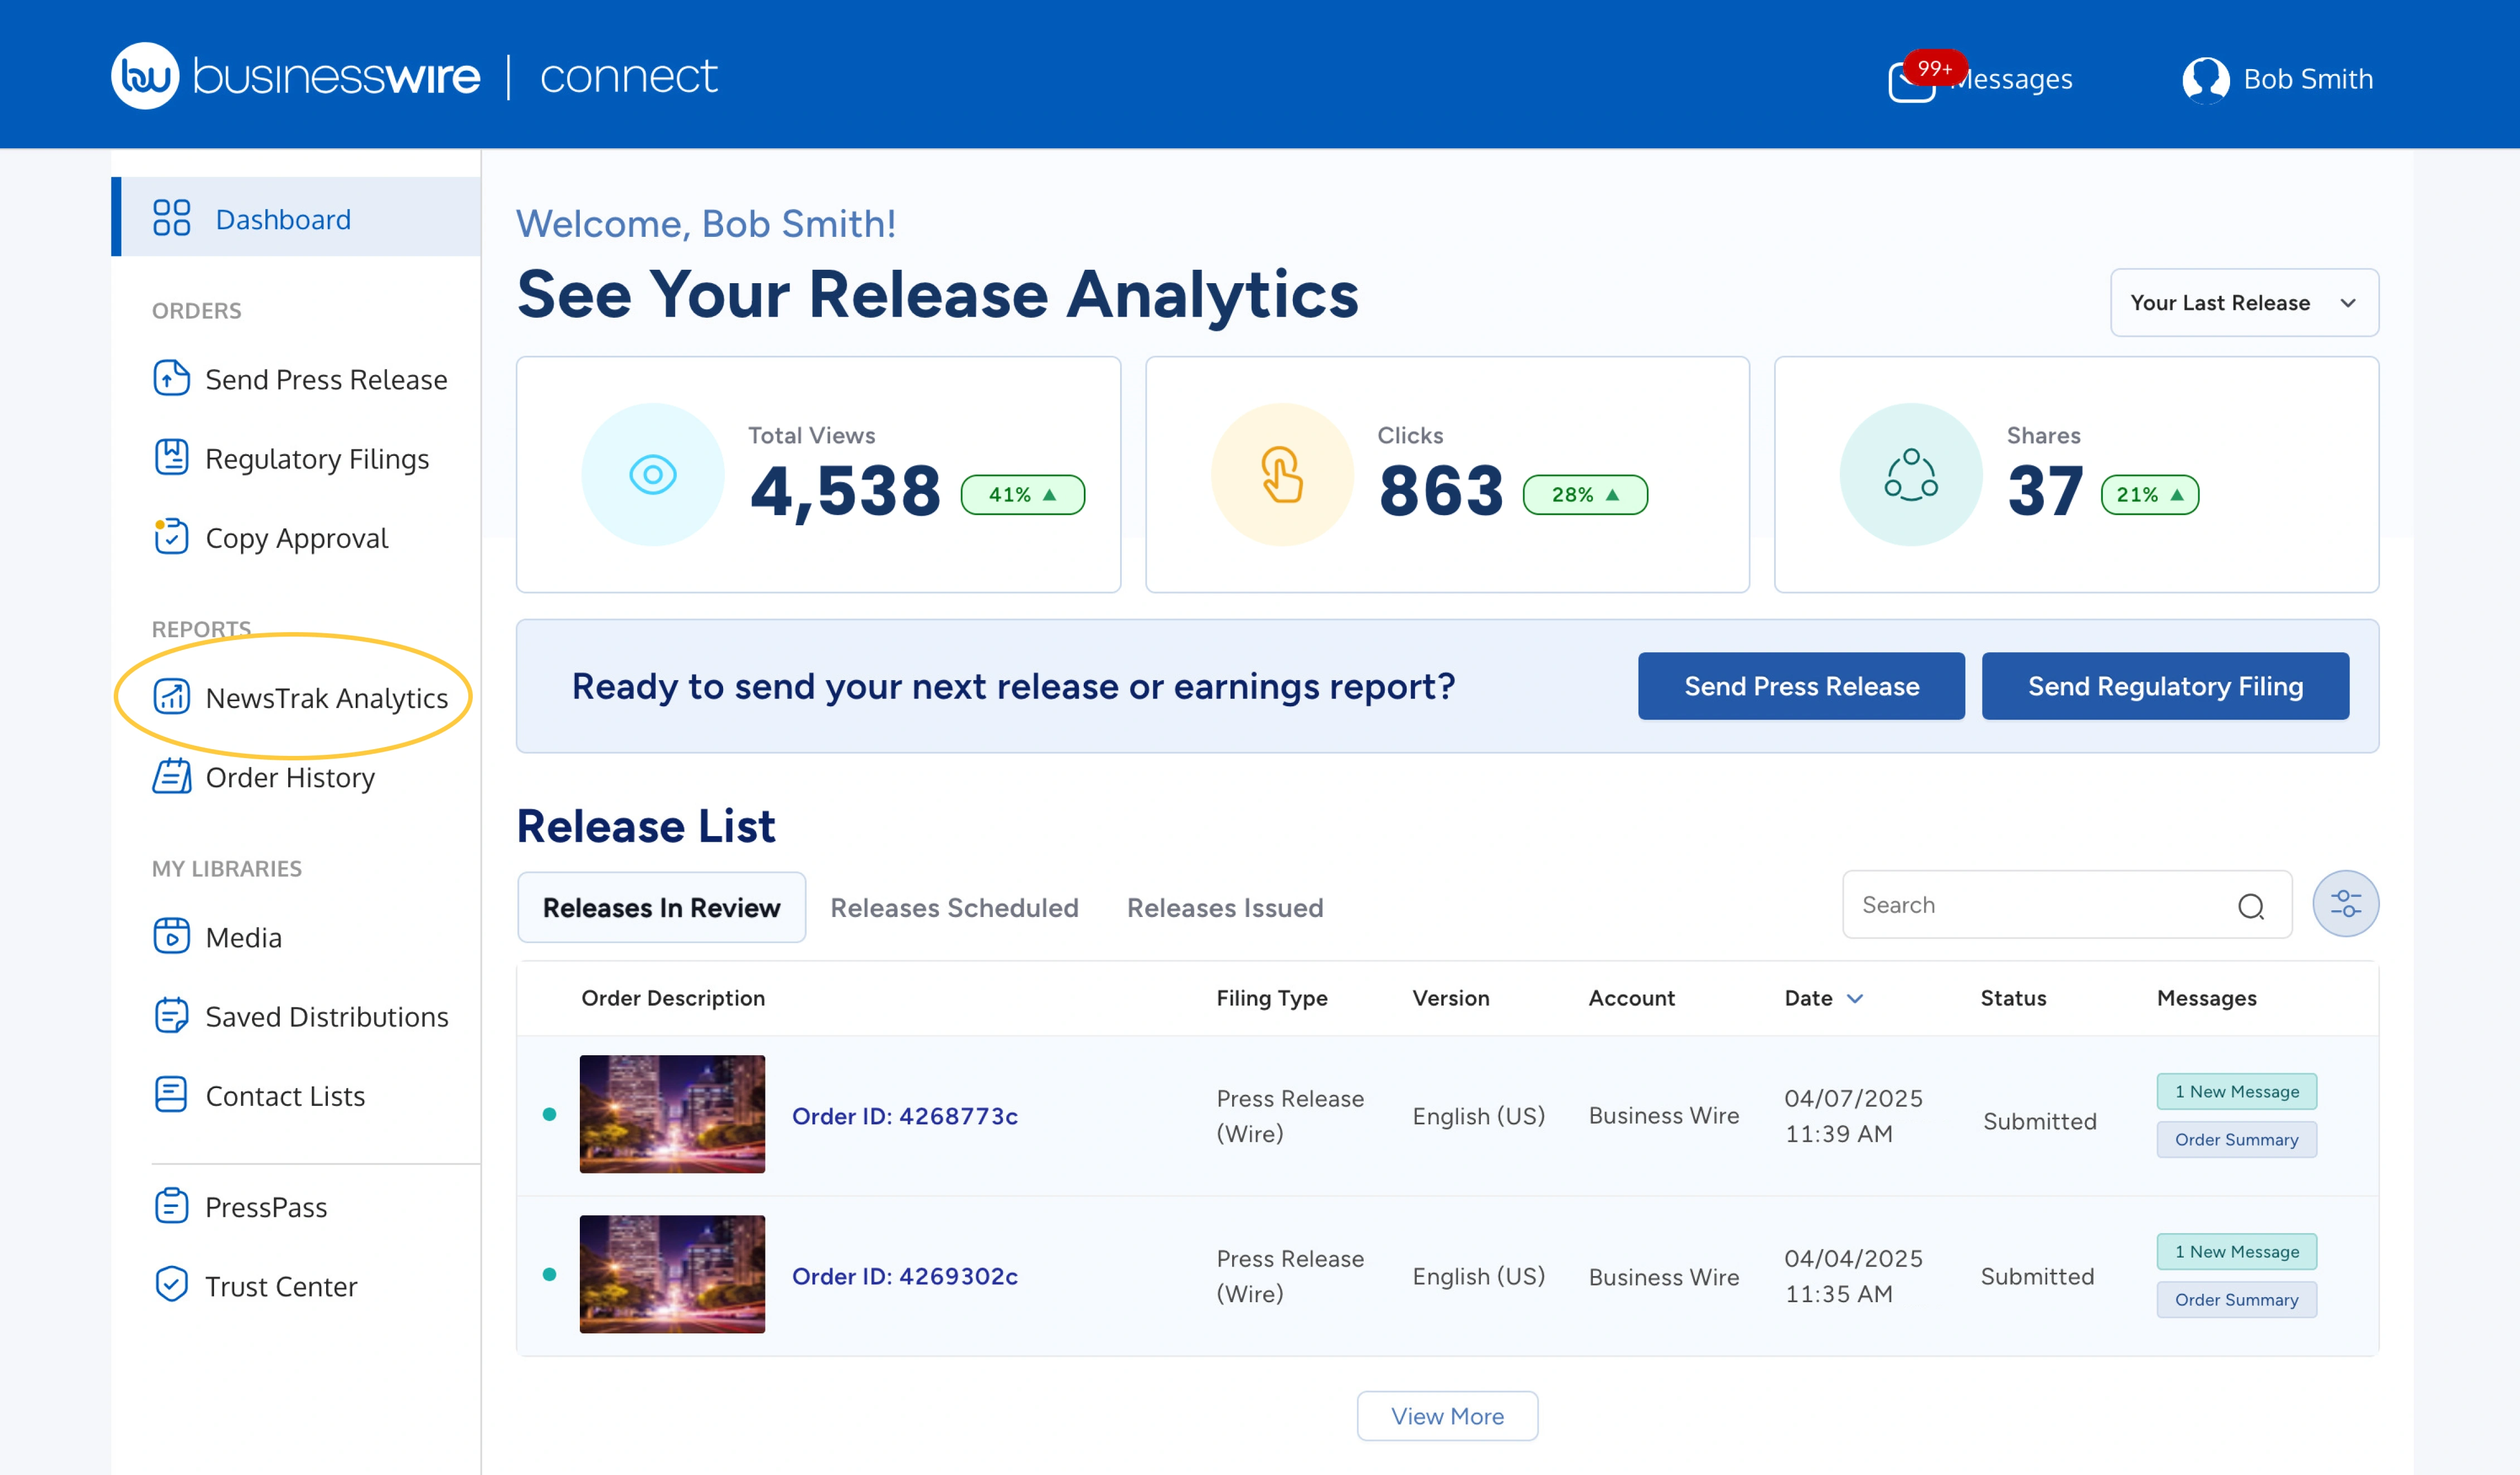
You can access NewsTrak Analytics and NewsTrak Reports by logging into Business Wire Connect and clicking "NewsTrak Analytics" on the left sidebar menu.
To view your press release’s NewsTrak Report, you can also:
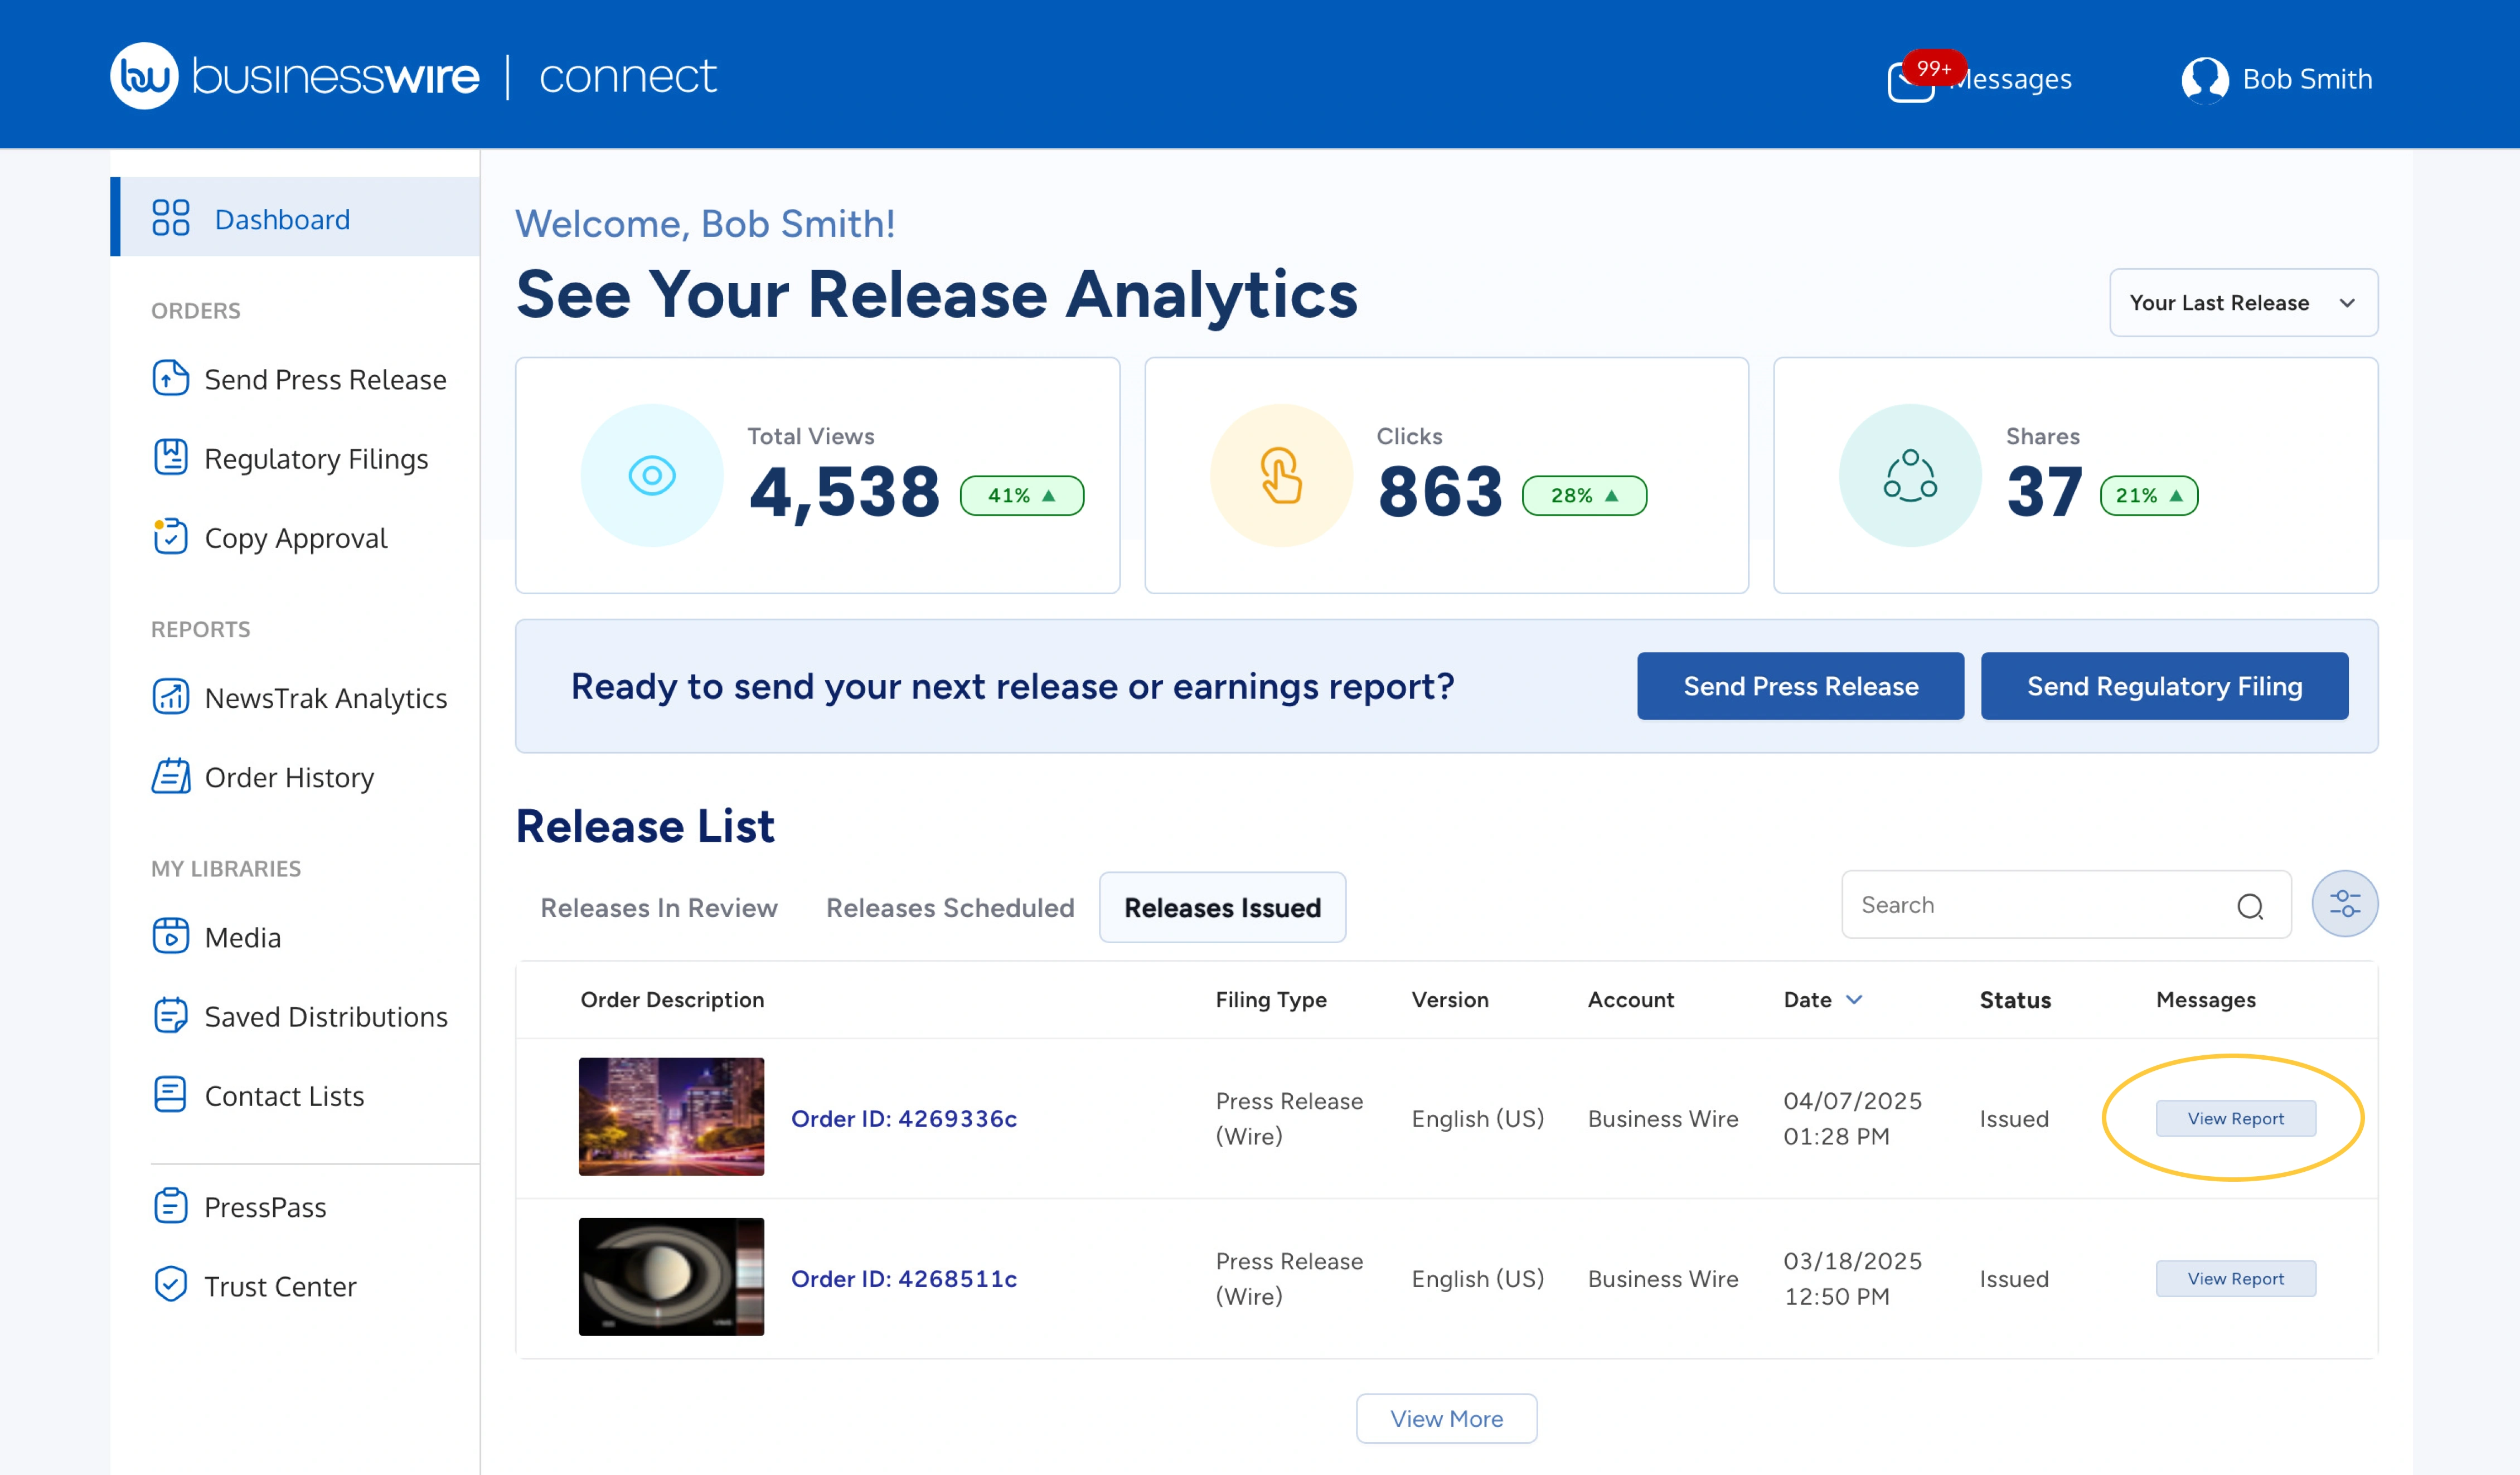
- Go to the Business Wire Connect Dashboard, view the Releases Issued tab, and click "View Report" in the Messages column.
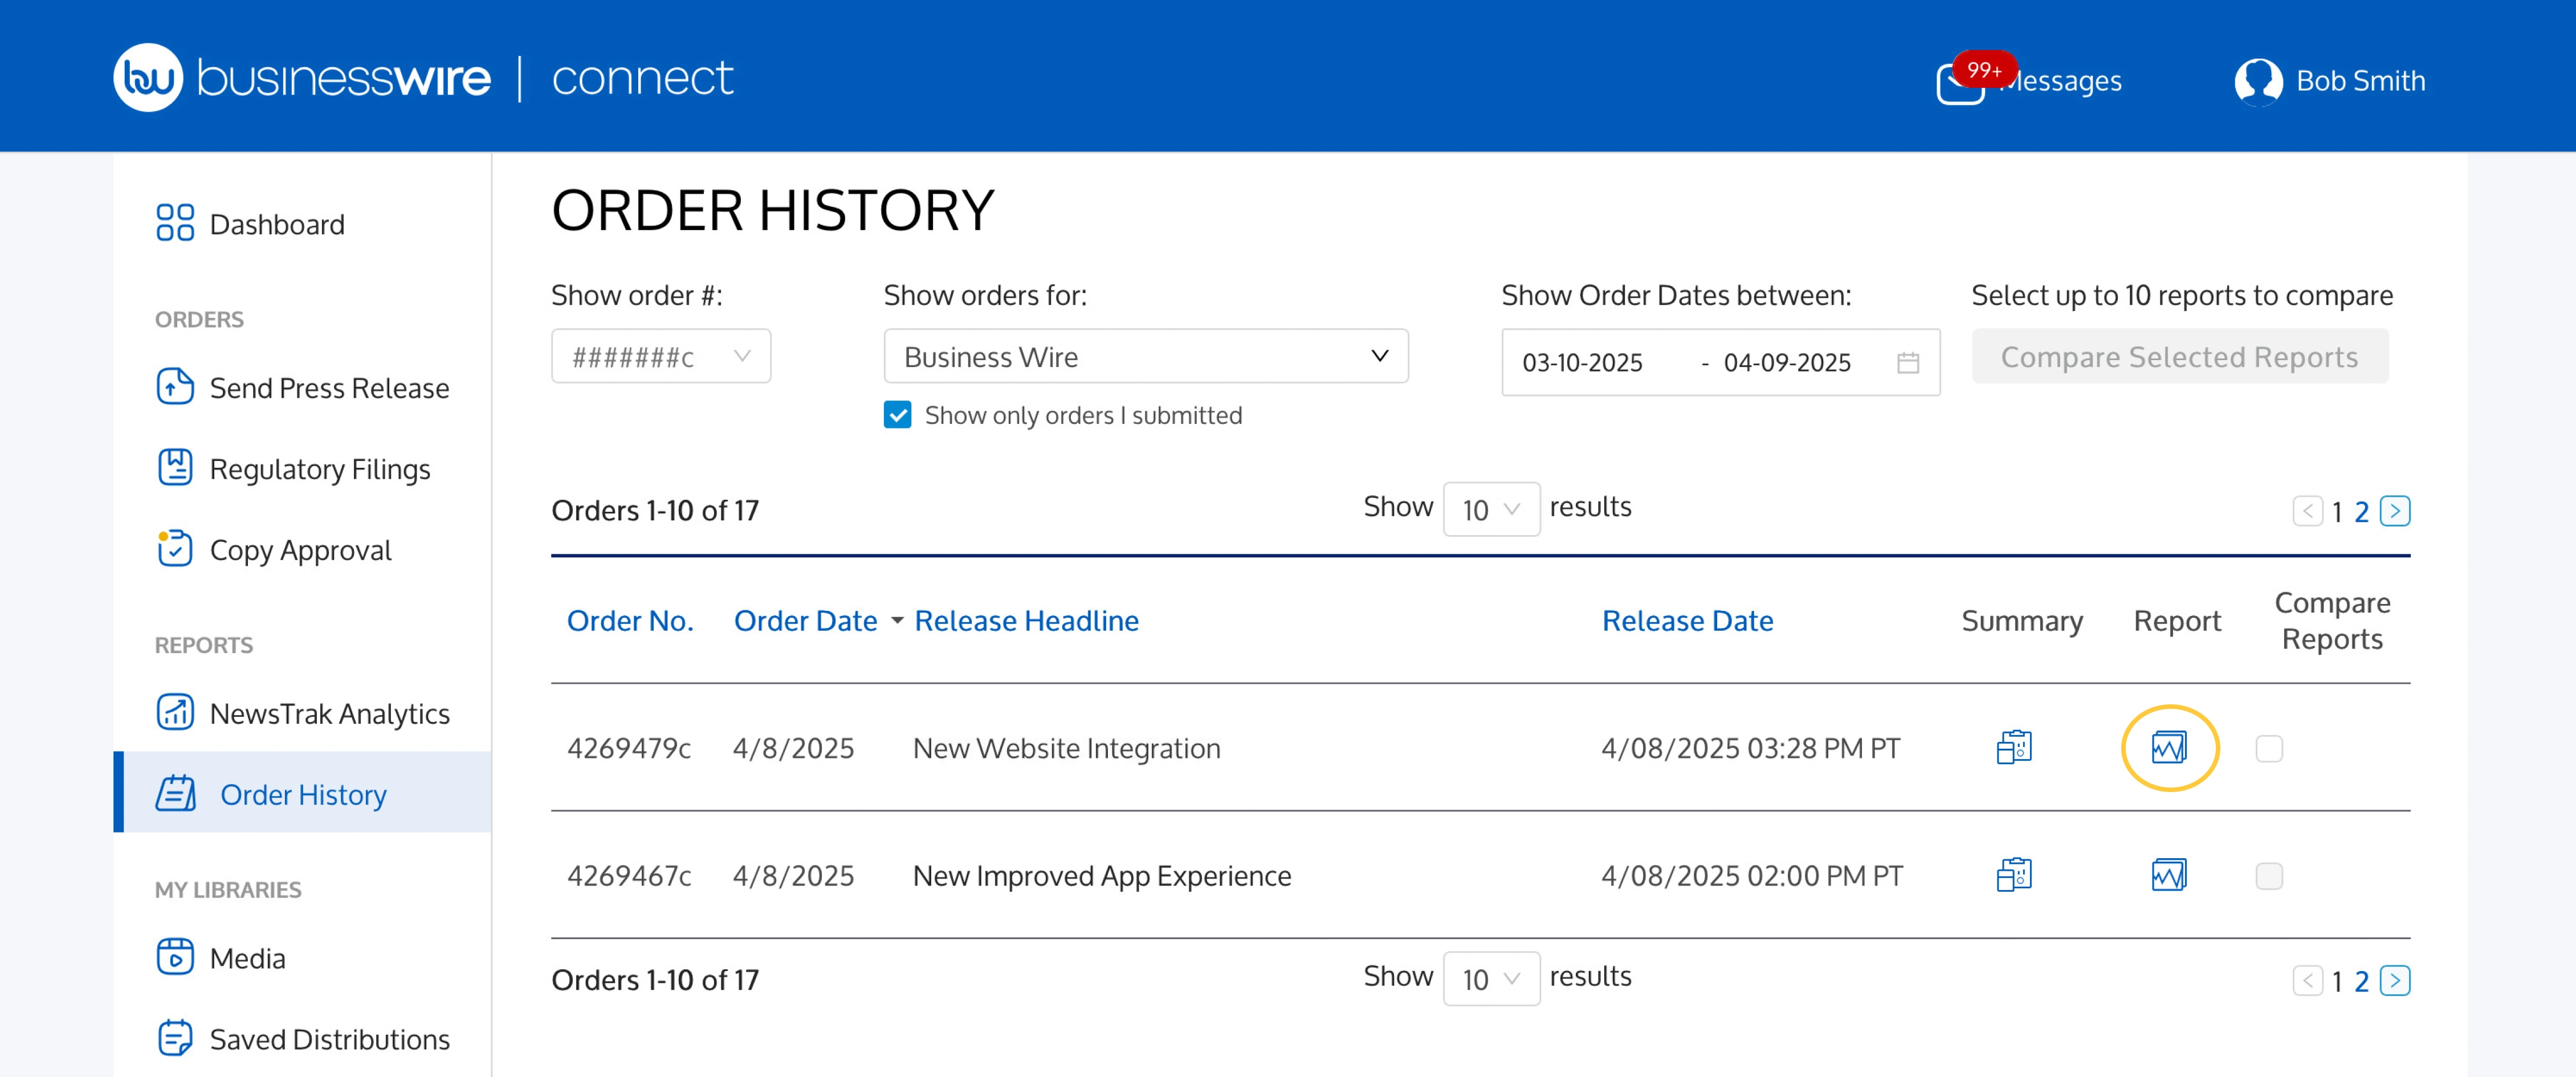
- From the Business Wire Connect Dashboard, click "Order History." Click the icon in the Report column next for the corresponding press release.
- Click the link from within your NewsTrak Report email notification.
- Skip to more information about NewsTrak Report functionality and data points.
Measure Results with the NewsTrak Analytics Table
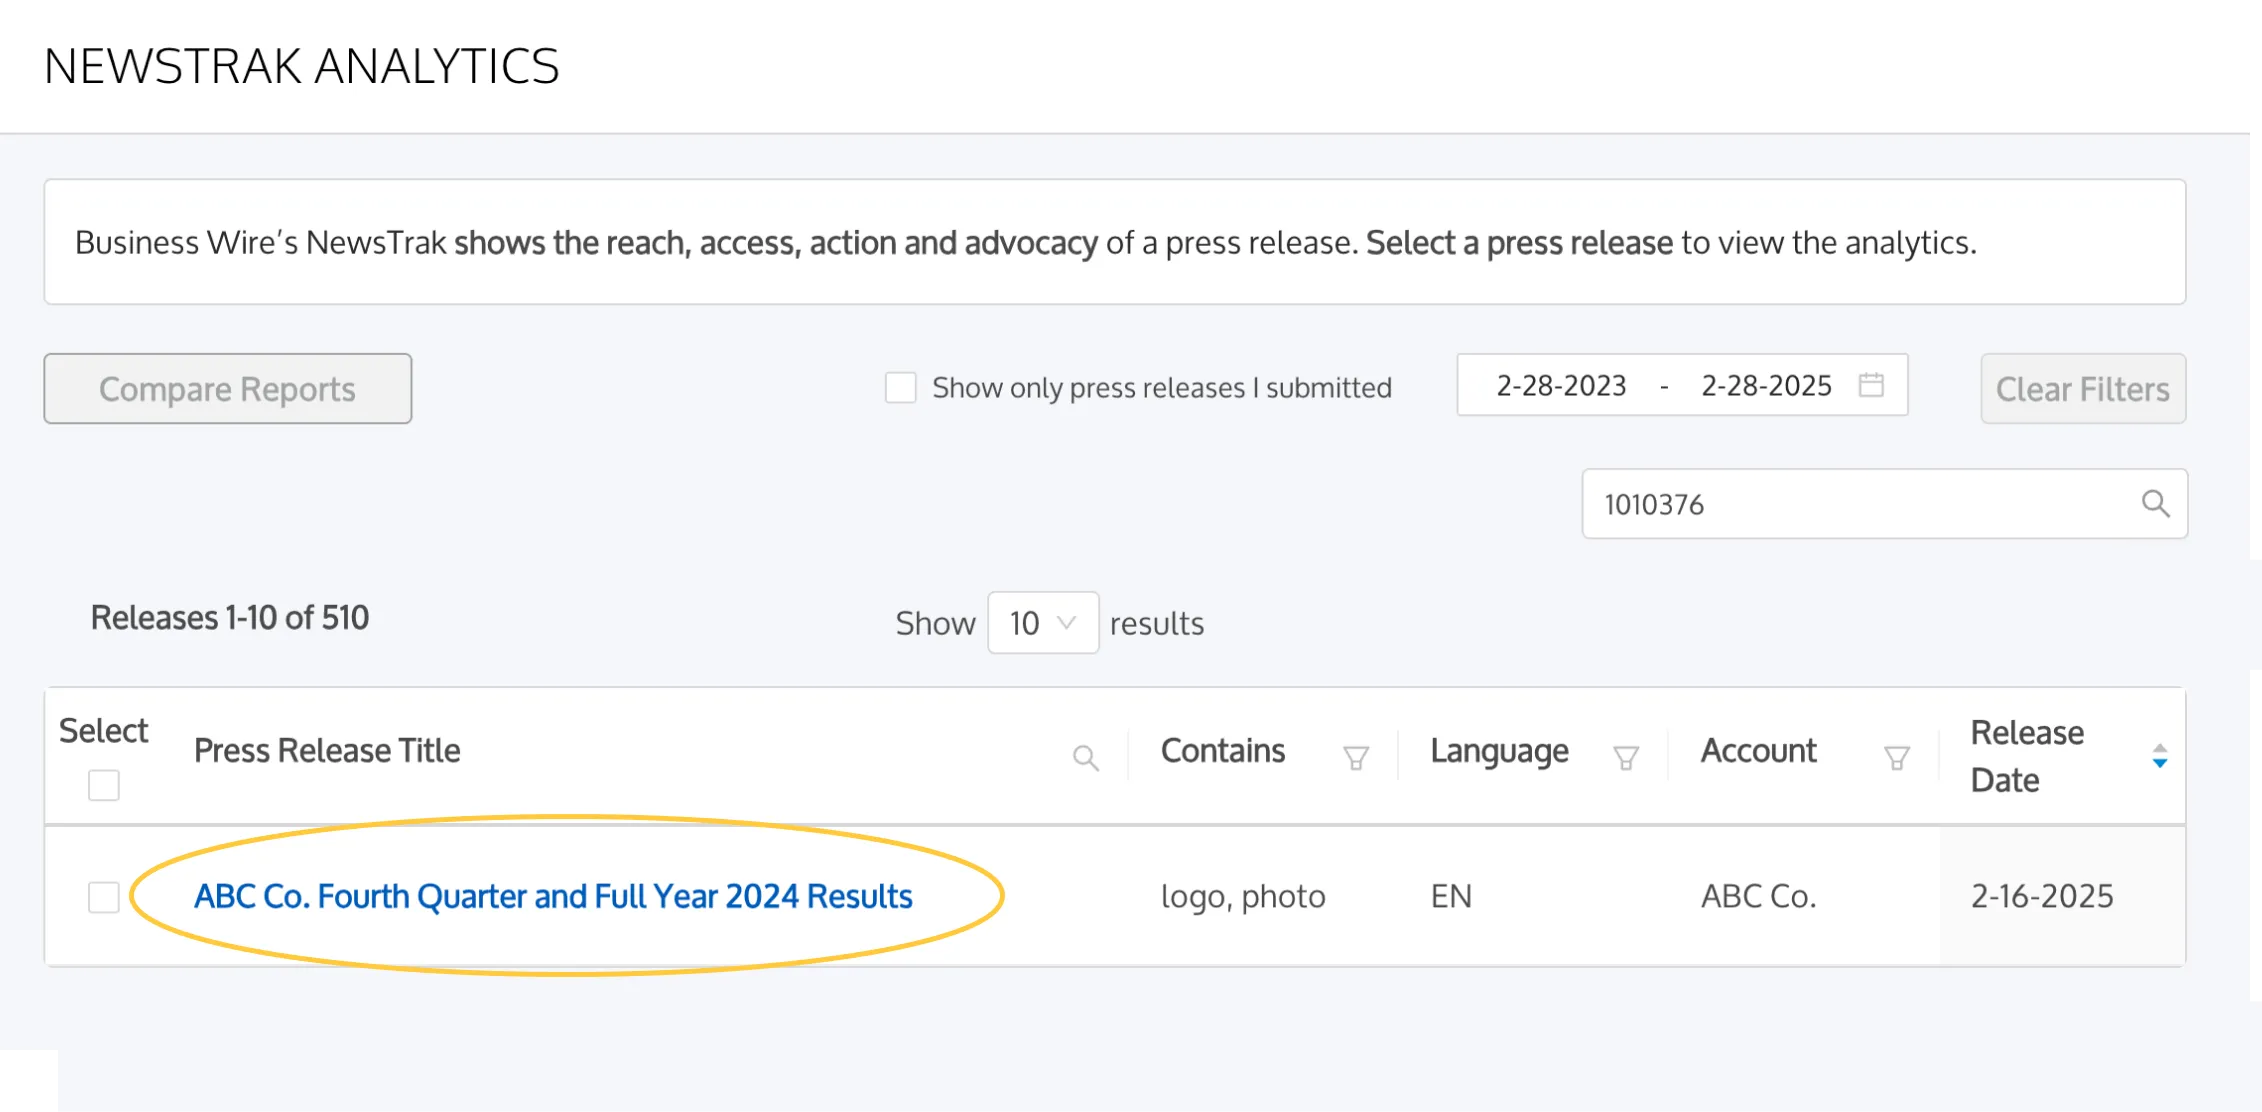
In Business Wire Connect, the NewsTrak Analytics page contains a table displaying a list of your press releases. Let's explore the table and its functionality.
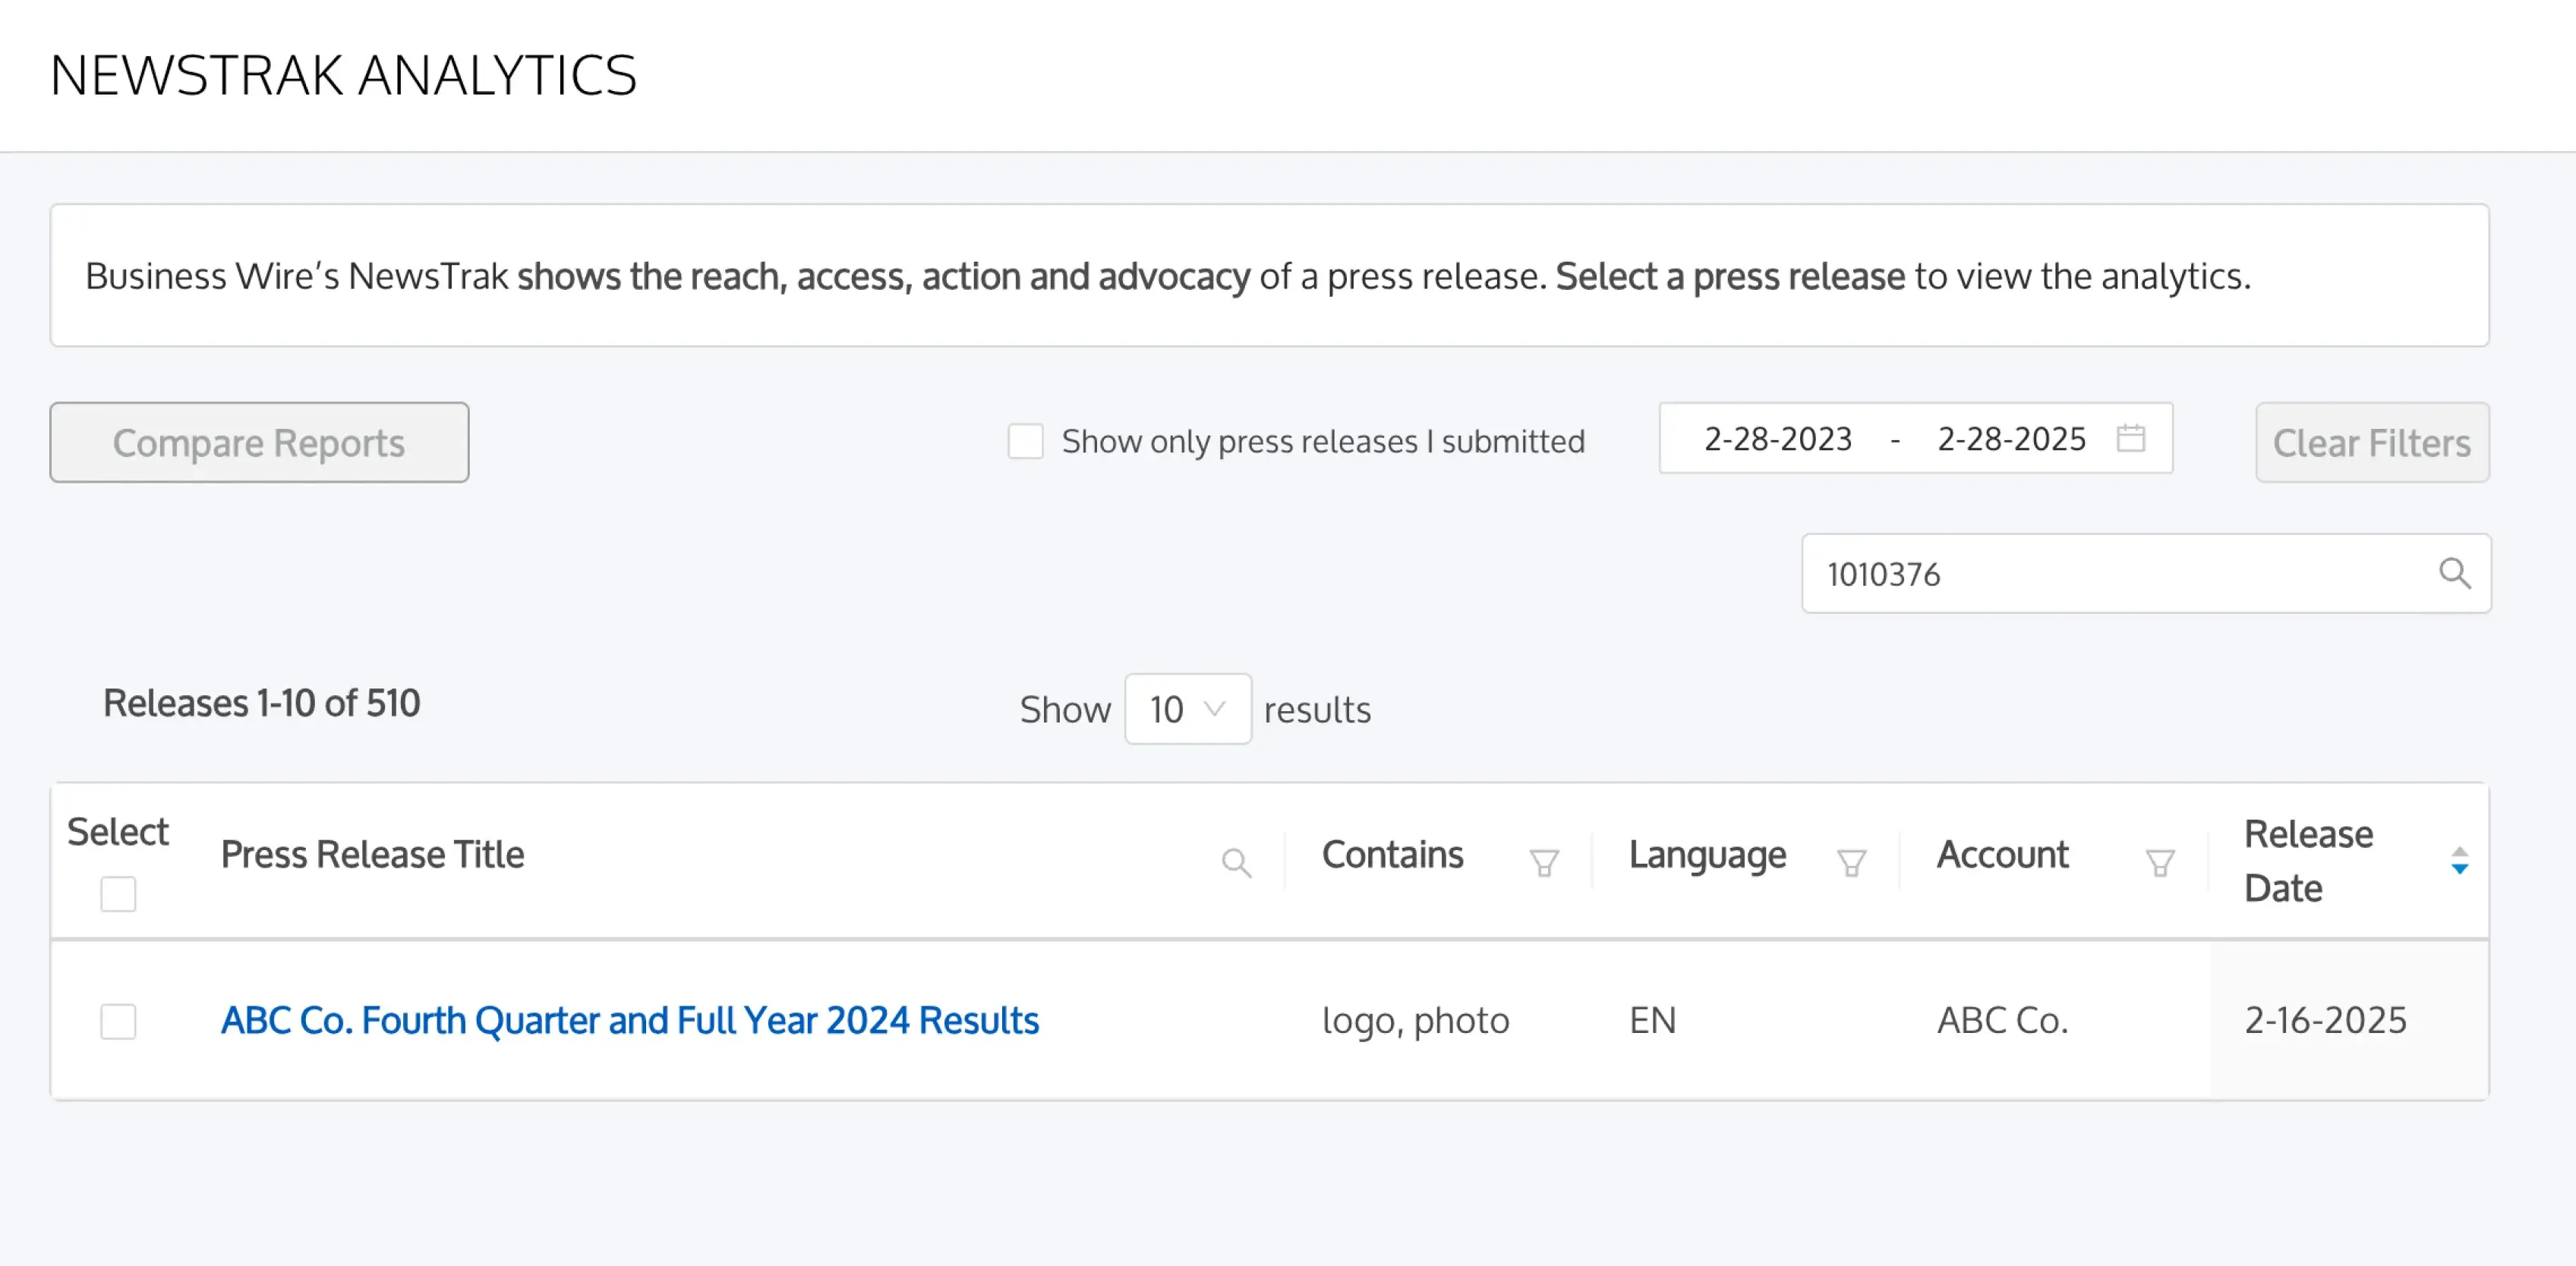
The table contains columns: Press Release Title, Contains, Language, Account, and Release Date.
Press Release Title
Displays distributed press releases by headline. Headlines will either be displayed in English or in the language of the first translated press release distributed per your order.
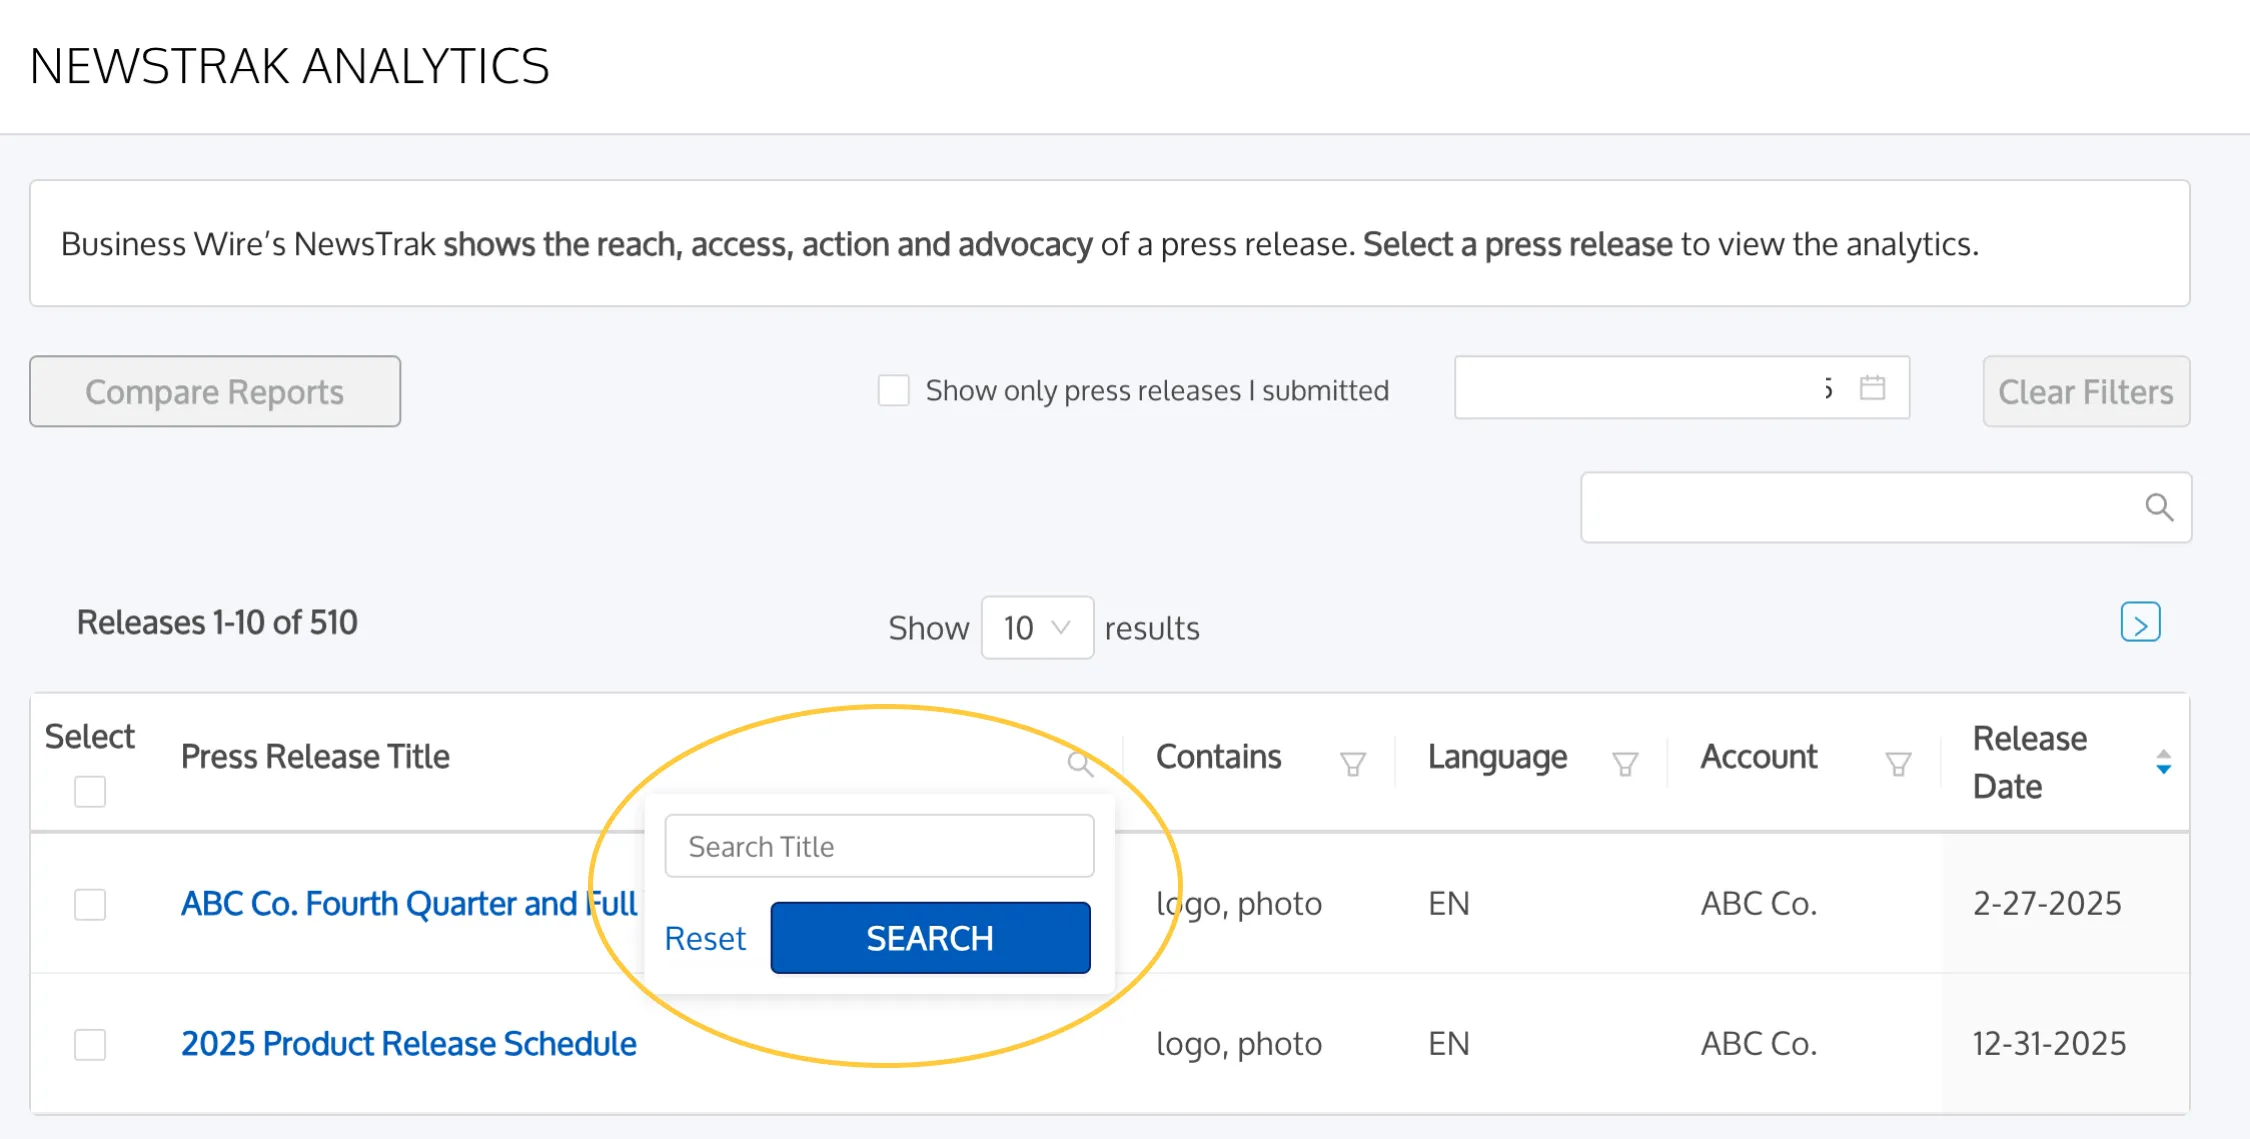
Clicking "Press Release Title" allows you to search for press releases based on keywords in the headline.
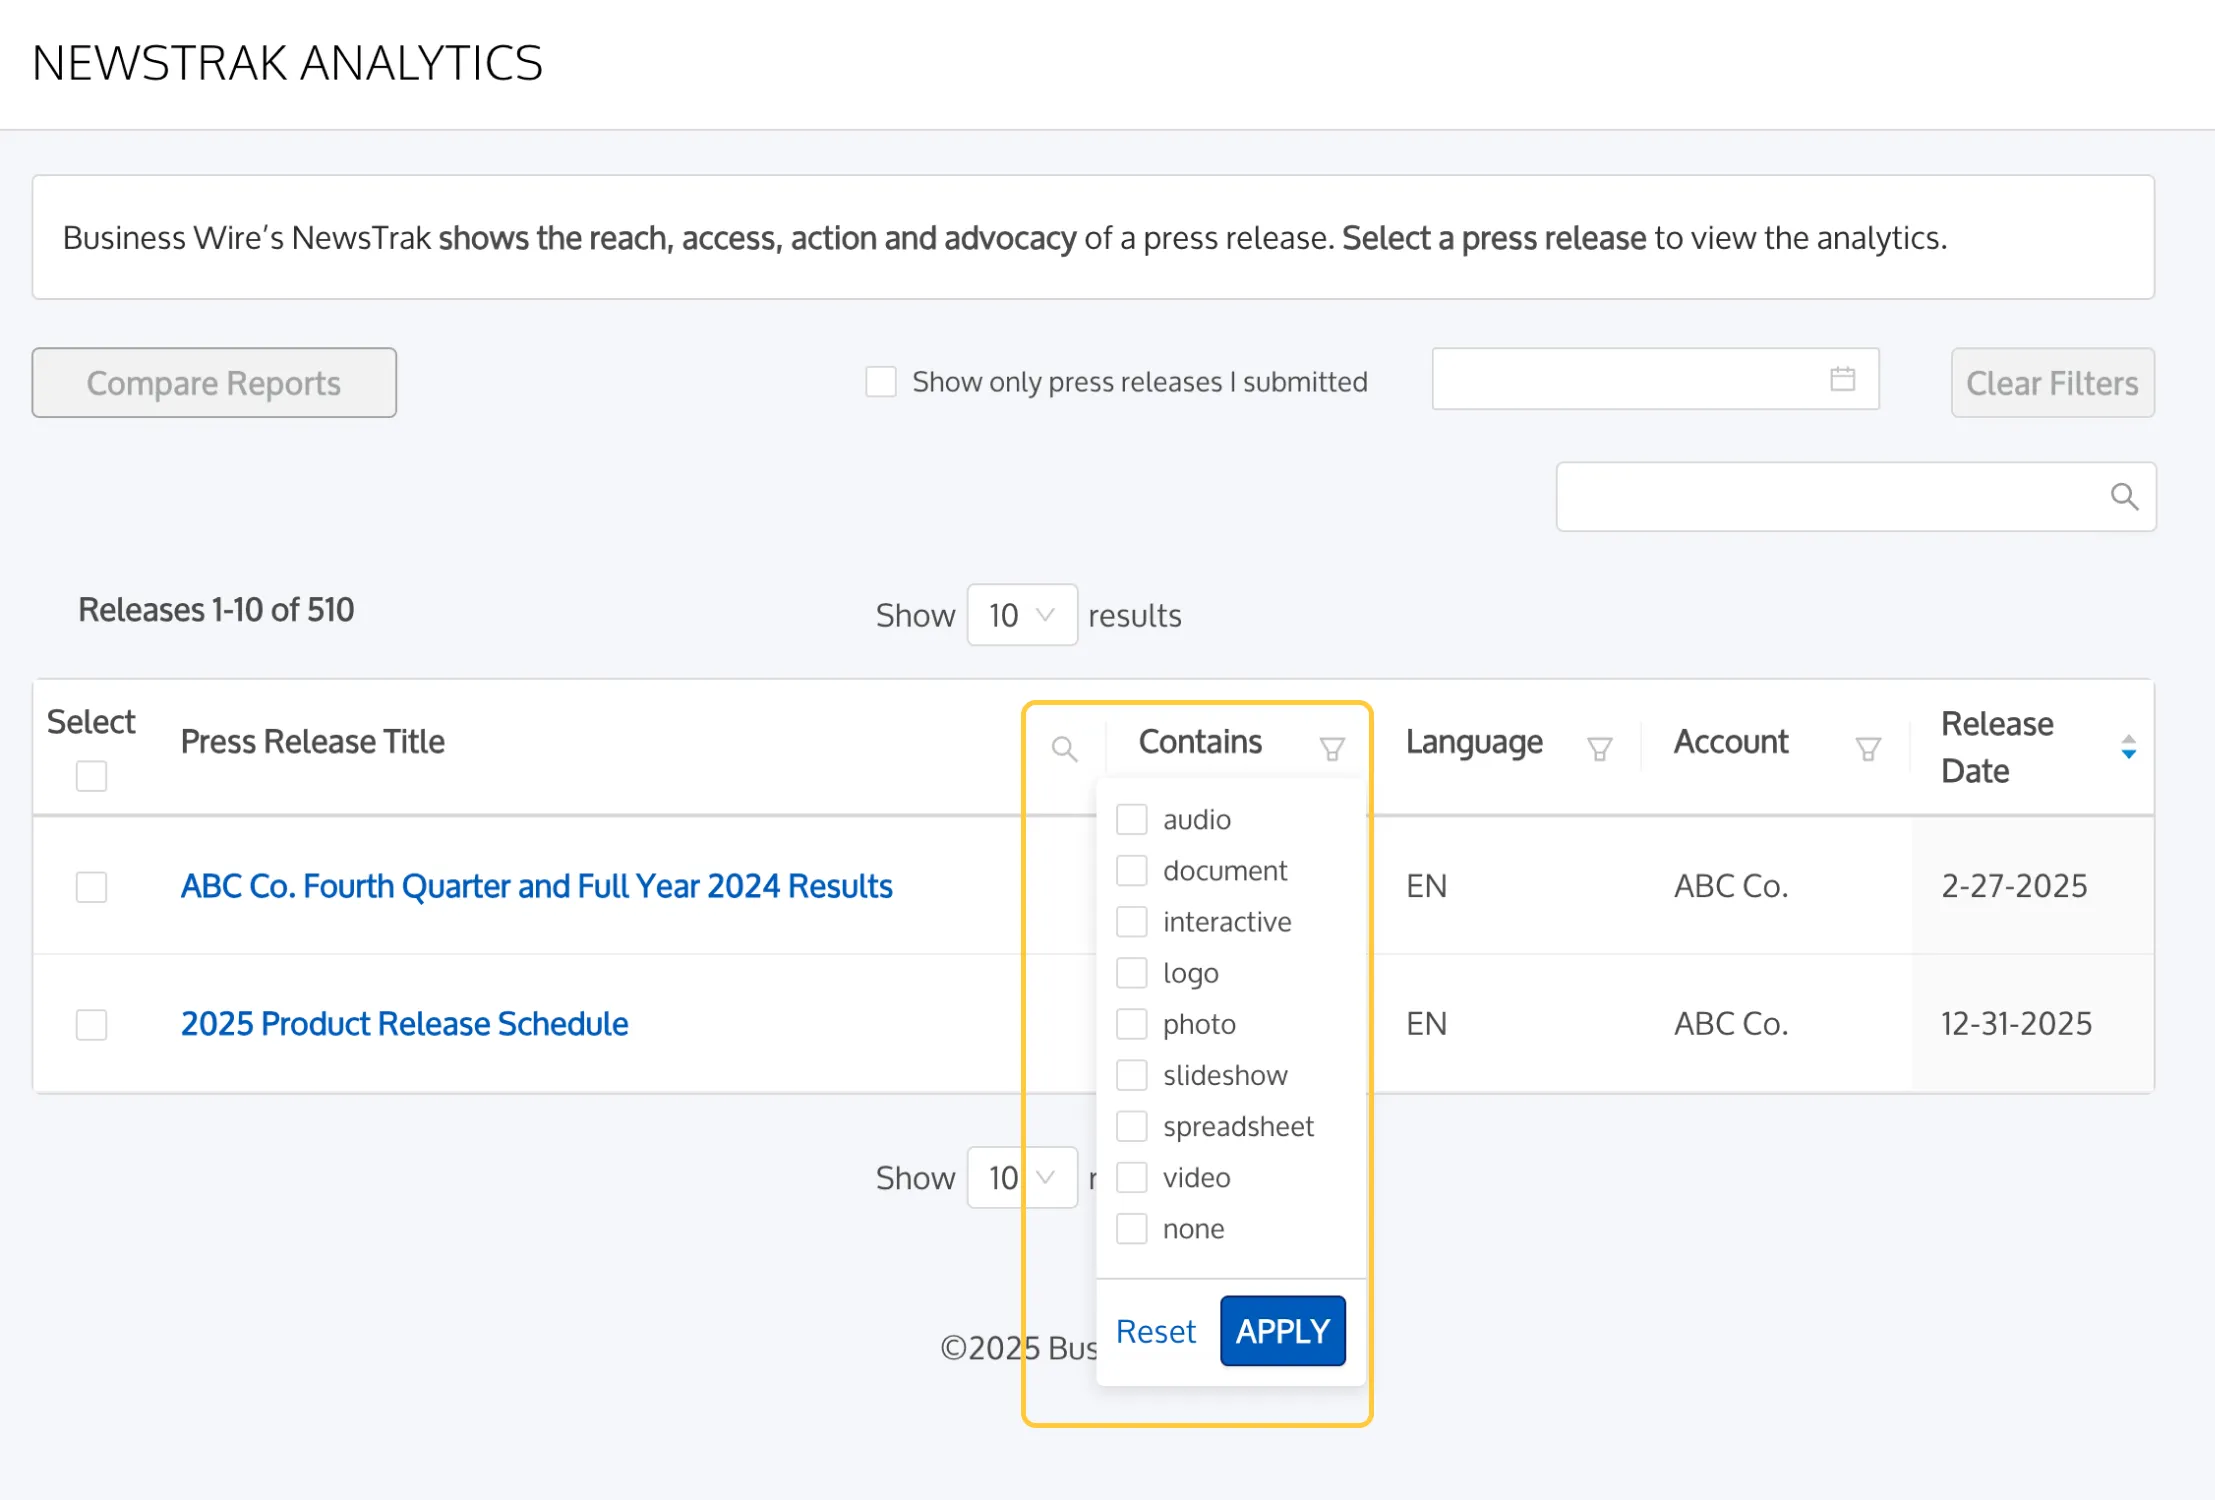
Contains
Indicates the types of multimedia associated with your press release order (when applicable).
Clicking "Contains" allows you to filter by the type of multimedia associated with your press release.
Filter options include: logo, photo, interactive (Interactive Media), audio, slideshow, video, document, and spreadsheet.
Language
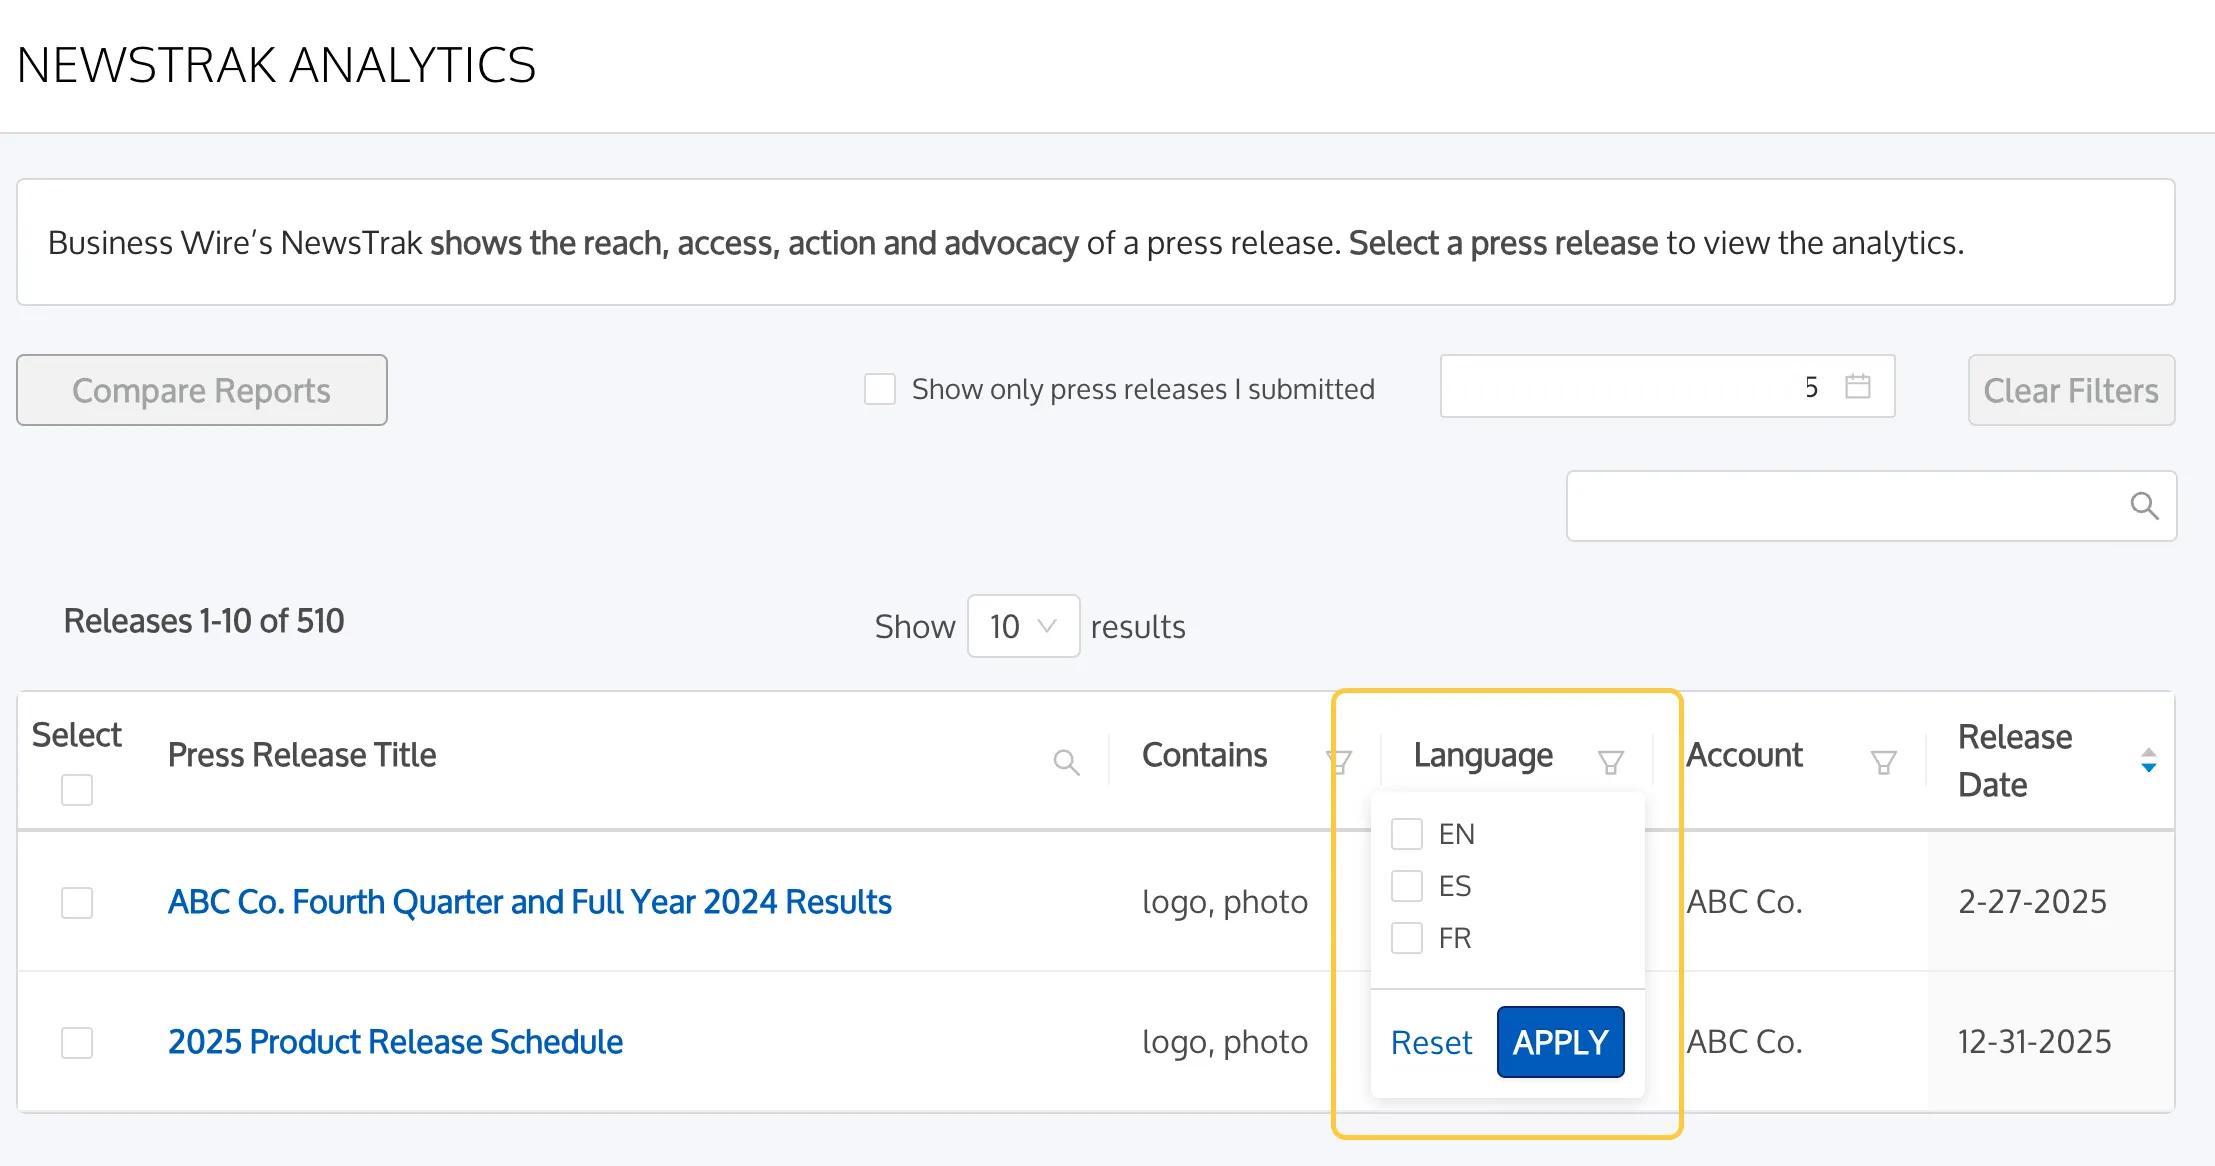
Lists the language(s) of the press release(s) for your order.
Clicking "Language" allows you to filter by language.
Languages are displayed using two-letter labels.
| EN | English | IT | Italian | JA | Japanese | ZH-HK | Traditional Chinese |
| ES | Spanish | CS | Czech | NL | Dutch | FI | Finnish |
| FR | French | ZH-CN | Simplified Chinese | SV | Swedish | HU | Hungarian |
| DE | German | PT | Portuguese | DA | Danish | PL | Polish |
Account
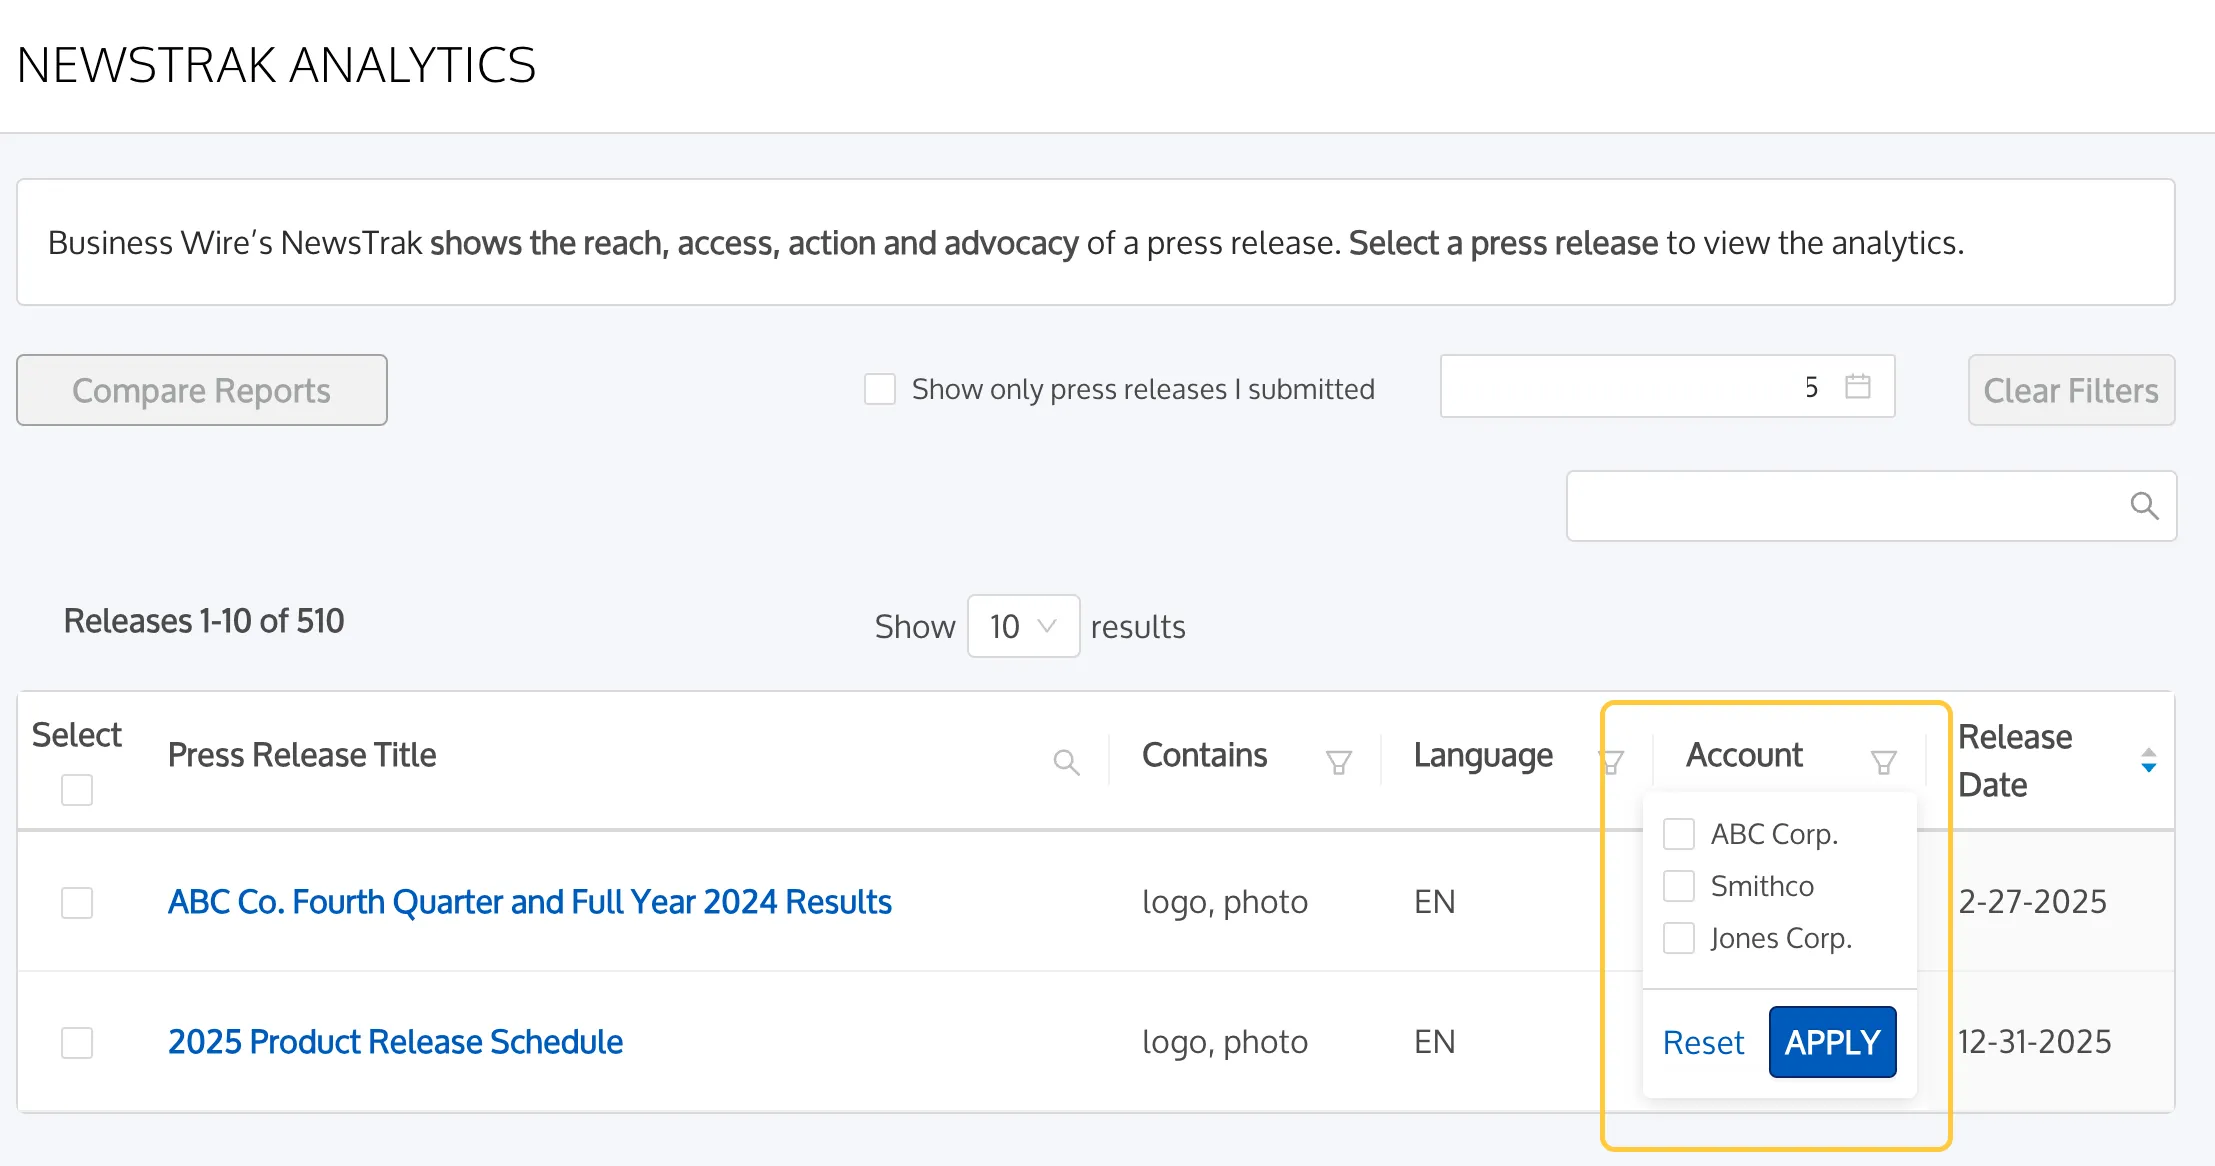
Lists the account for which the press release was sent.
Clicking "Account" allows you to filter by account.
If you only have one account, the filter will only display your account.
Release Date
Displays the date your press release was distributed.
Clicking "Release Date" sorts dates by ascending (oldest to newest) or descending (newest to oldest).
The default view displays the most recently distributed press release first.
NewsTrak Analytics Table Functionality
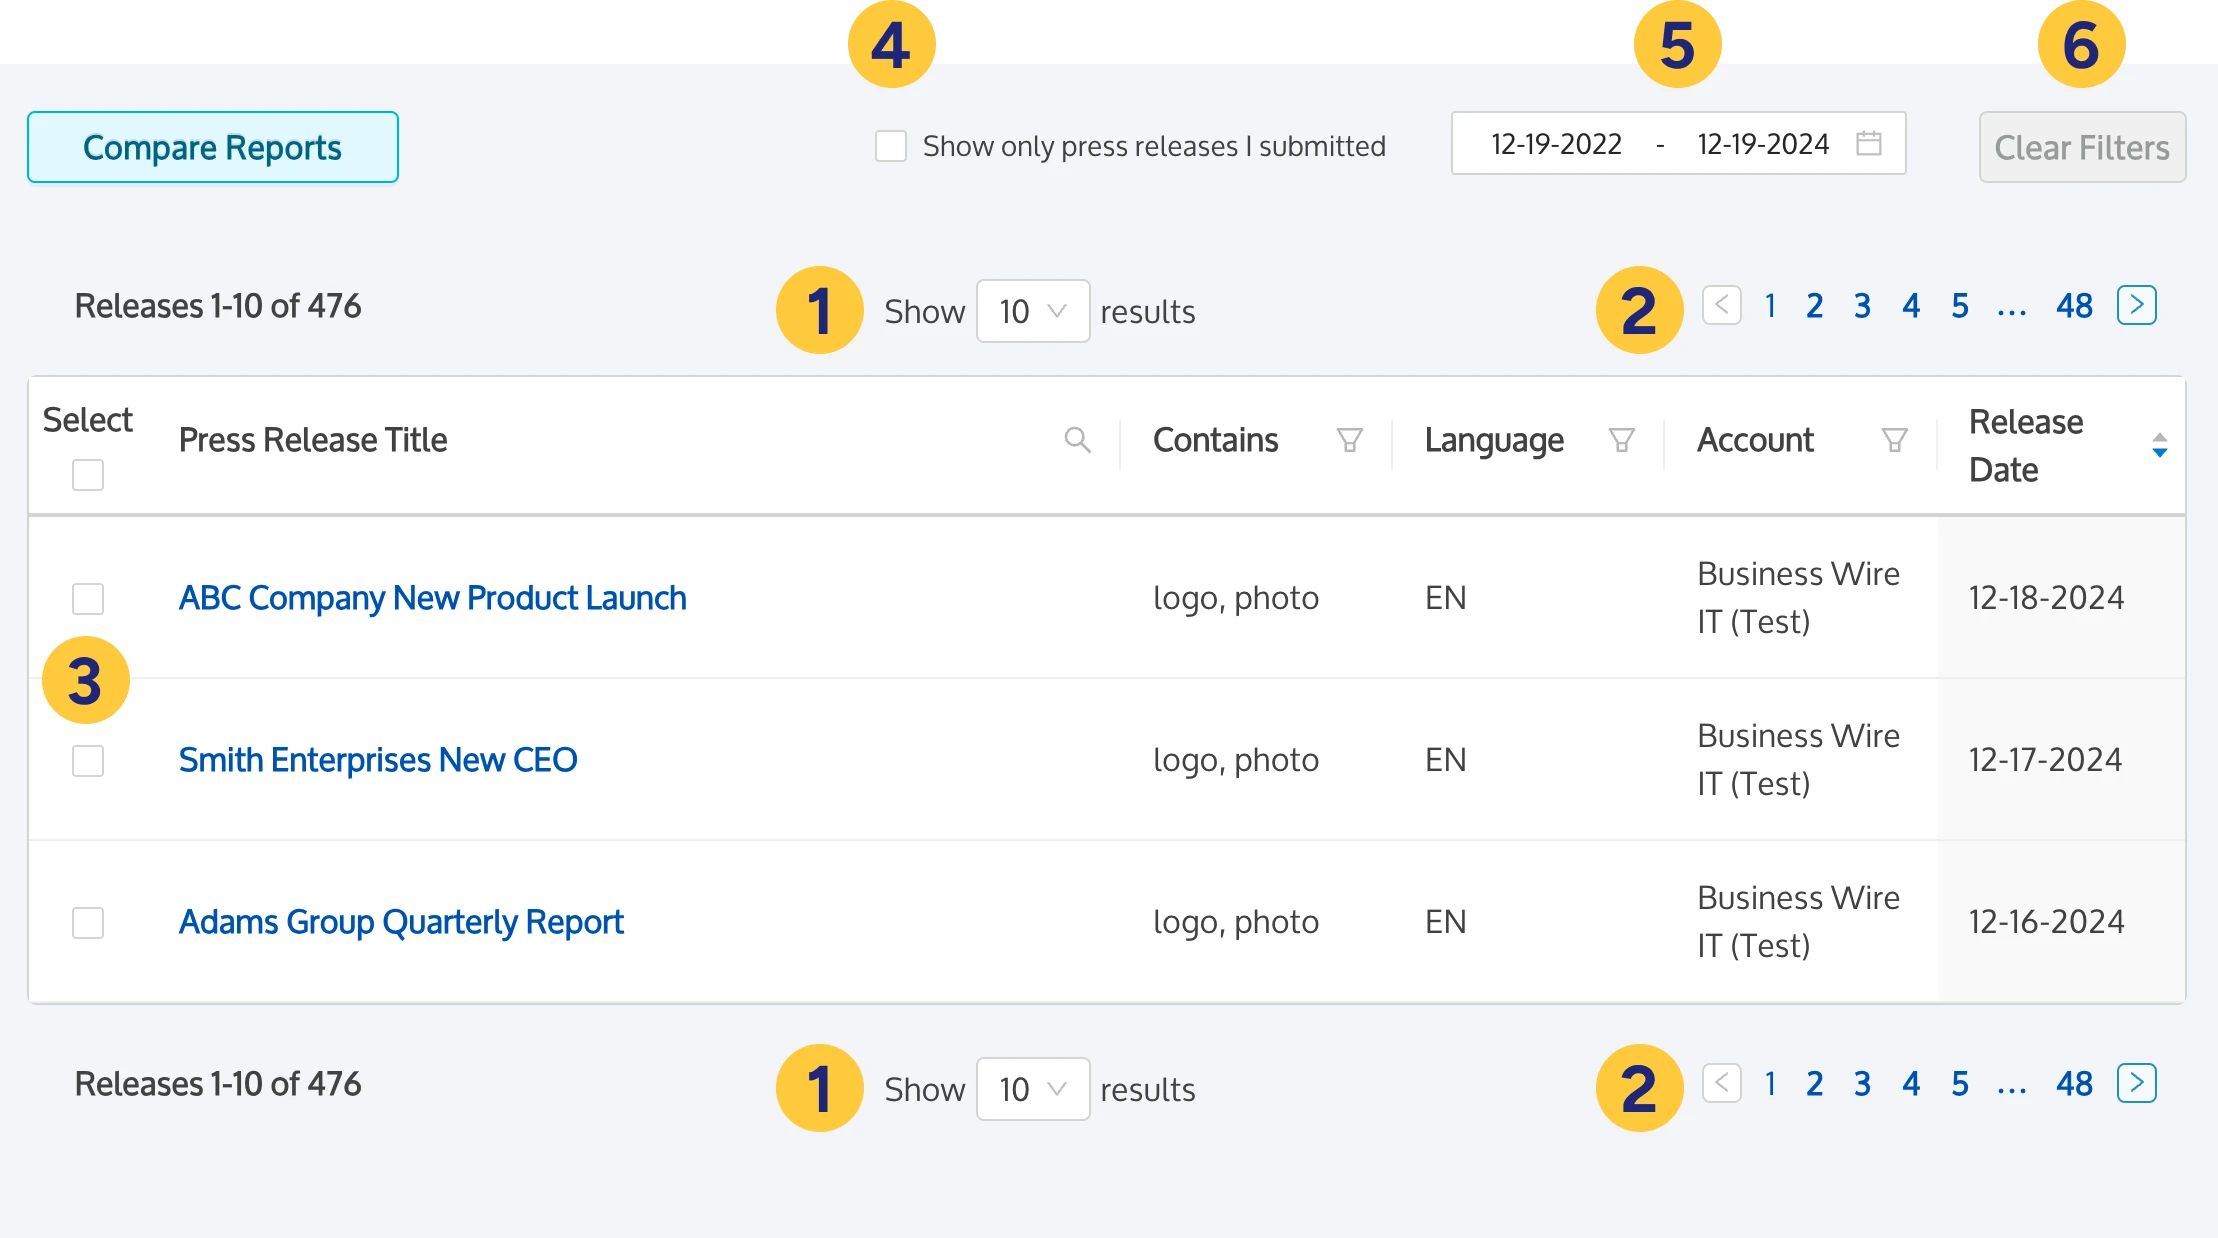
- A dropdown menu at the top and bottom of the table allows you to choose how many items to display at once (10, 25, 50, 100).
- Arrows in the upper and lower right allow you to easily click through the list of your press releases.
- Check boxes under the Select column allow you to pick press release reports to compare. Click here to learn how to compare multiple NewsTrak Reports.
- A check box above the table allows you to display only press releases you have submitted. If you only have one account user, this checkbox will be disabled.
- The date picker lets you select a date range of press release reports to display.
- Filters can be cleared by clicking the "Clear Filters" button.
Comparing NewsTrak Reports
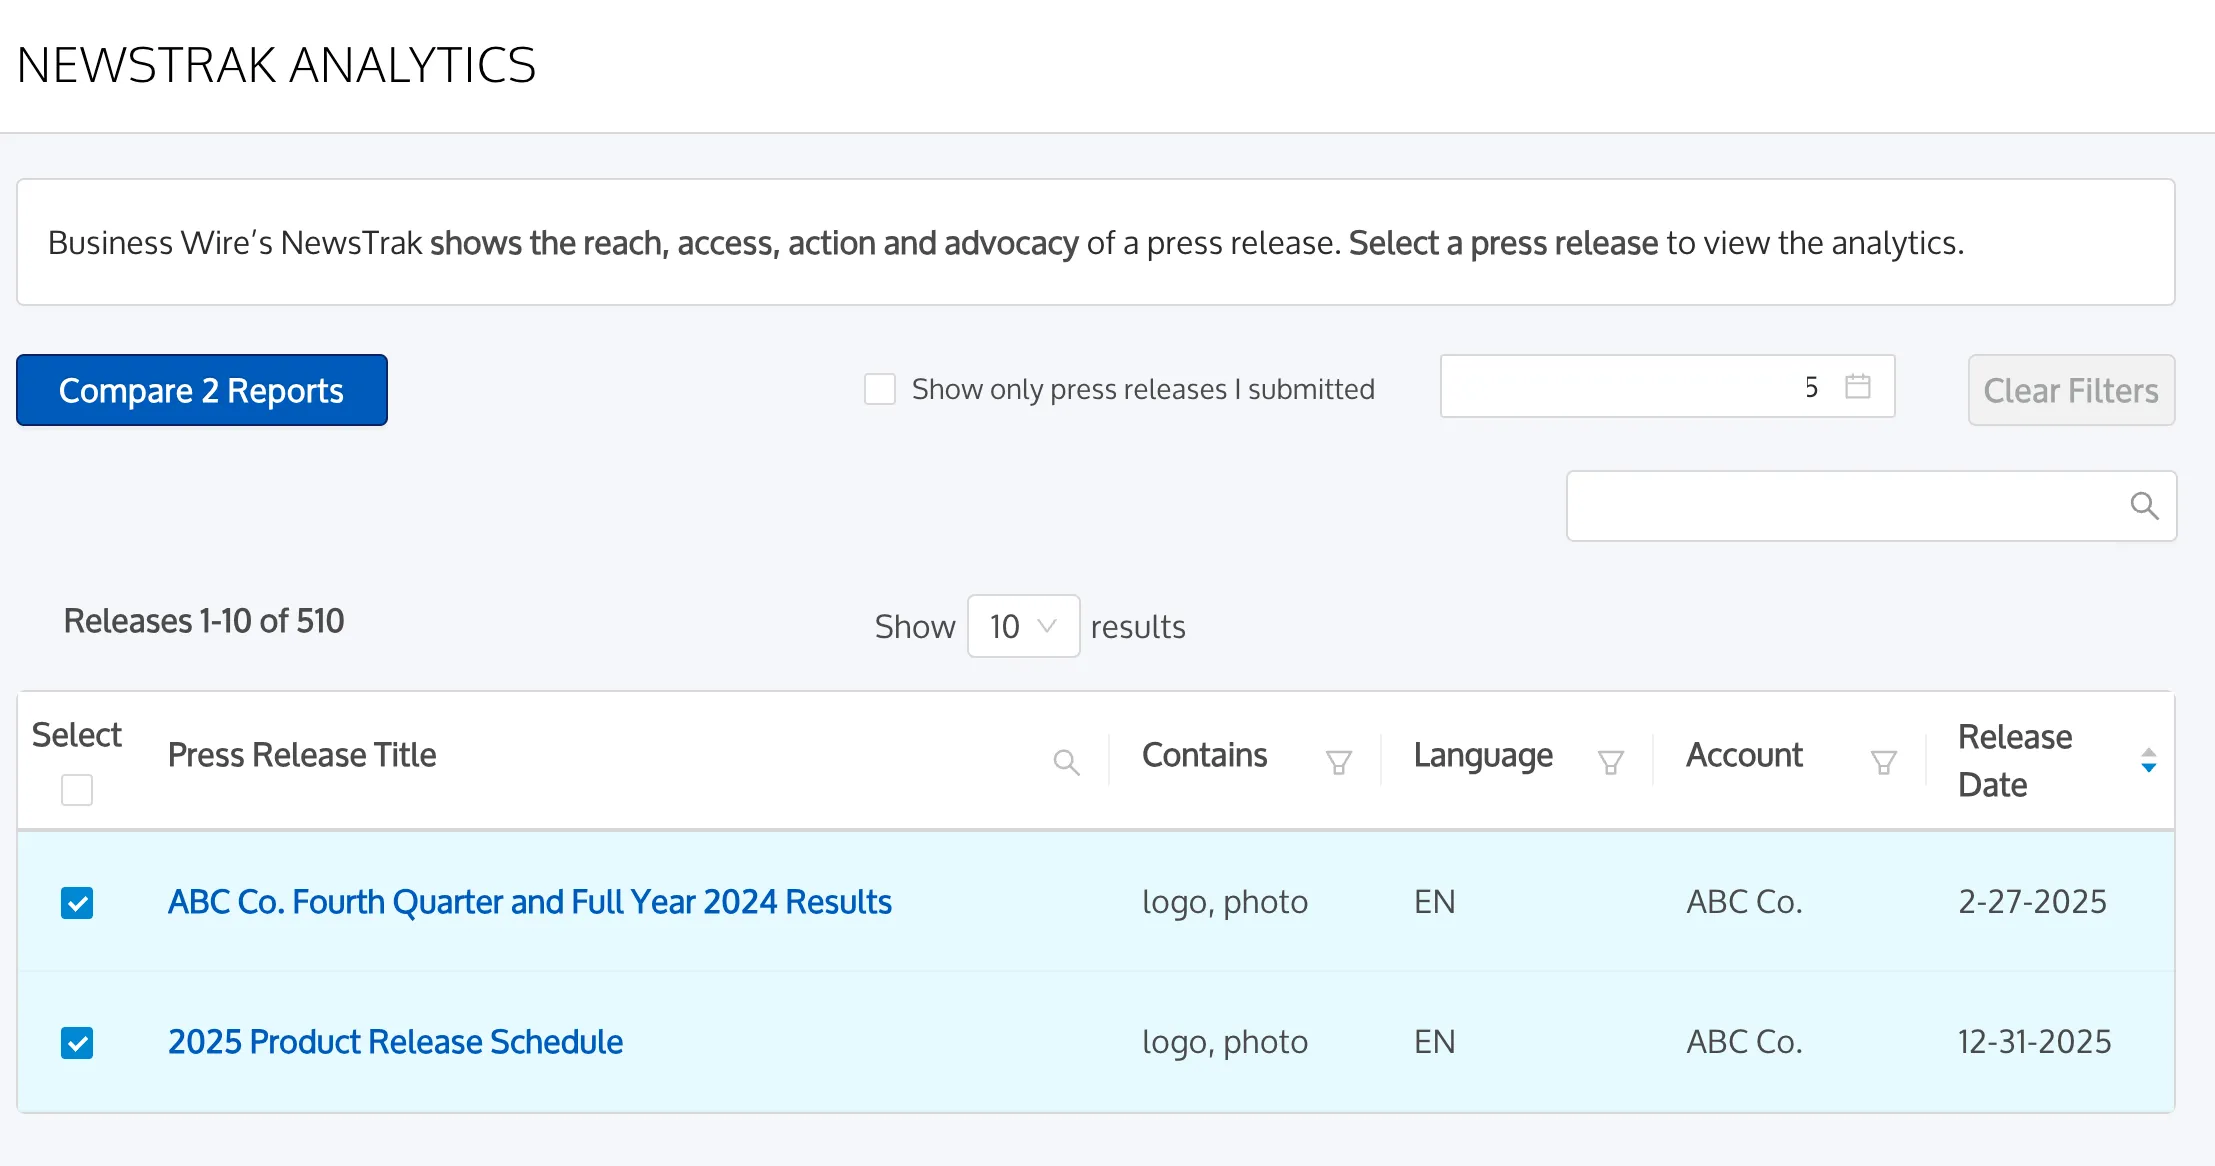
To compare two or more (limit of 25) NewsTrak Reports, click the checkboxes under the Select column of the reports you'd like to compare.
Click "Compare Results" in the upper left. A new screen will appear with your results.
NewsTrak Report Functionality
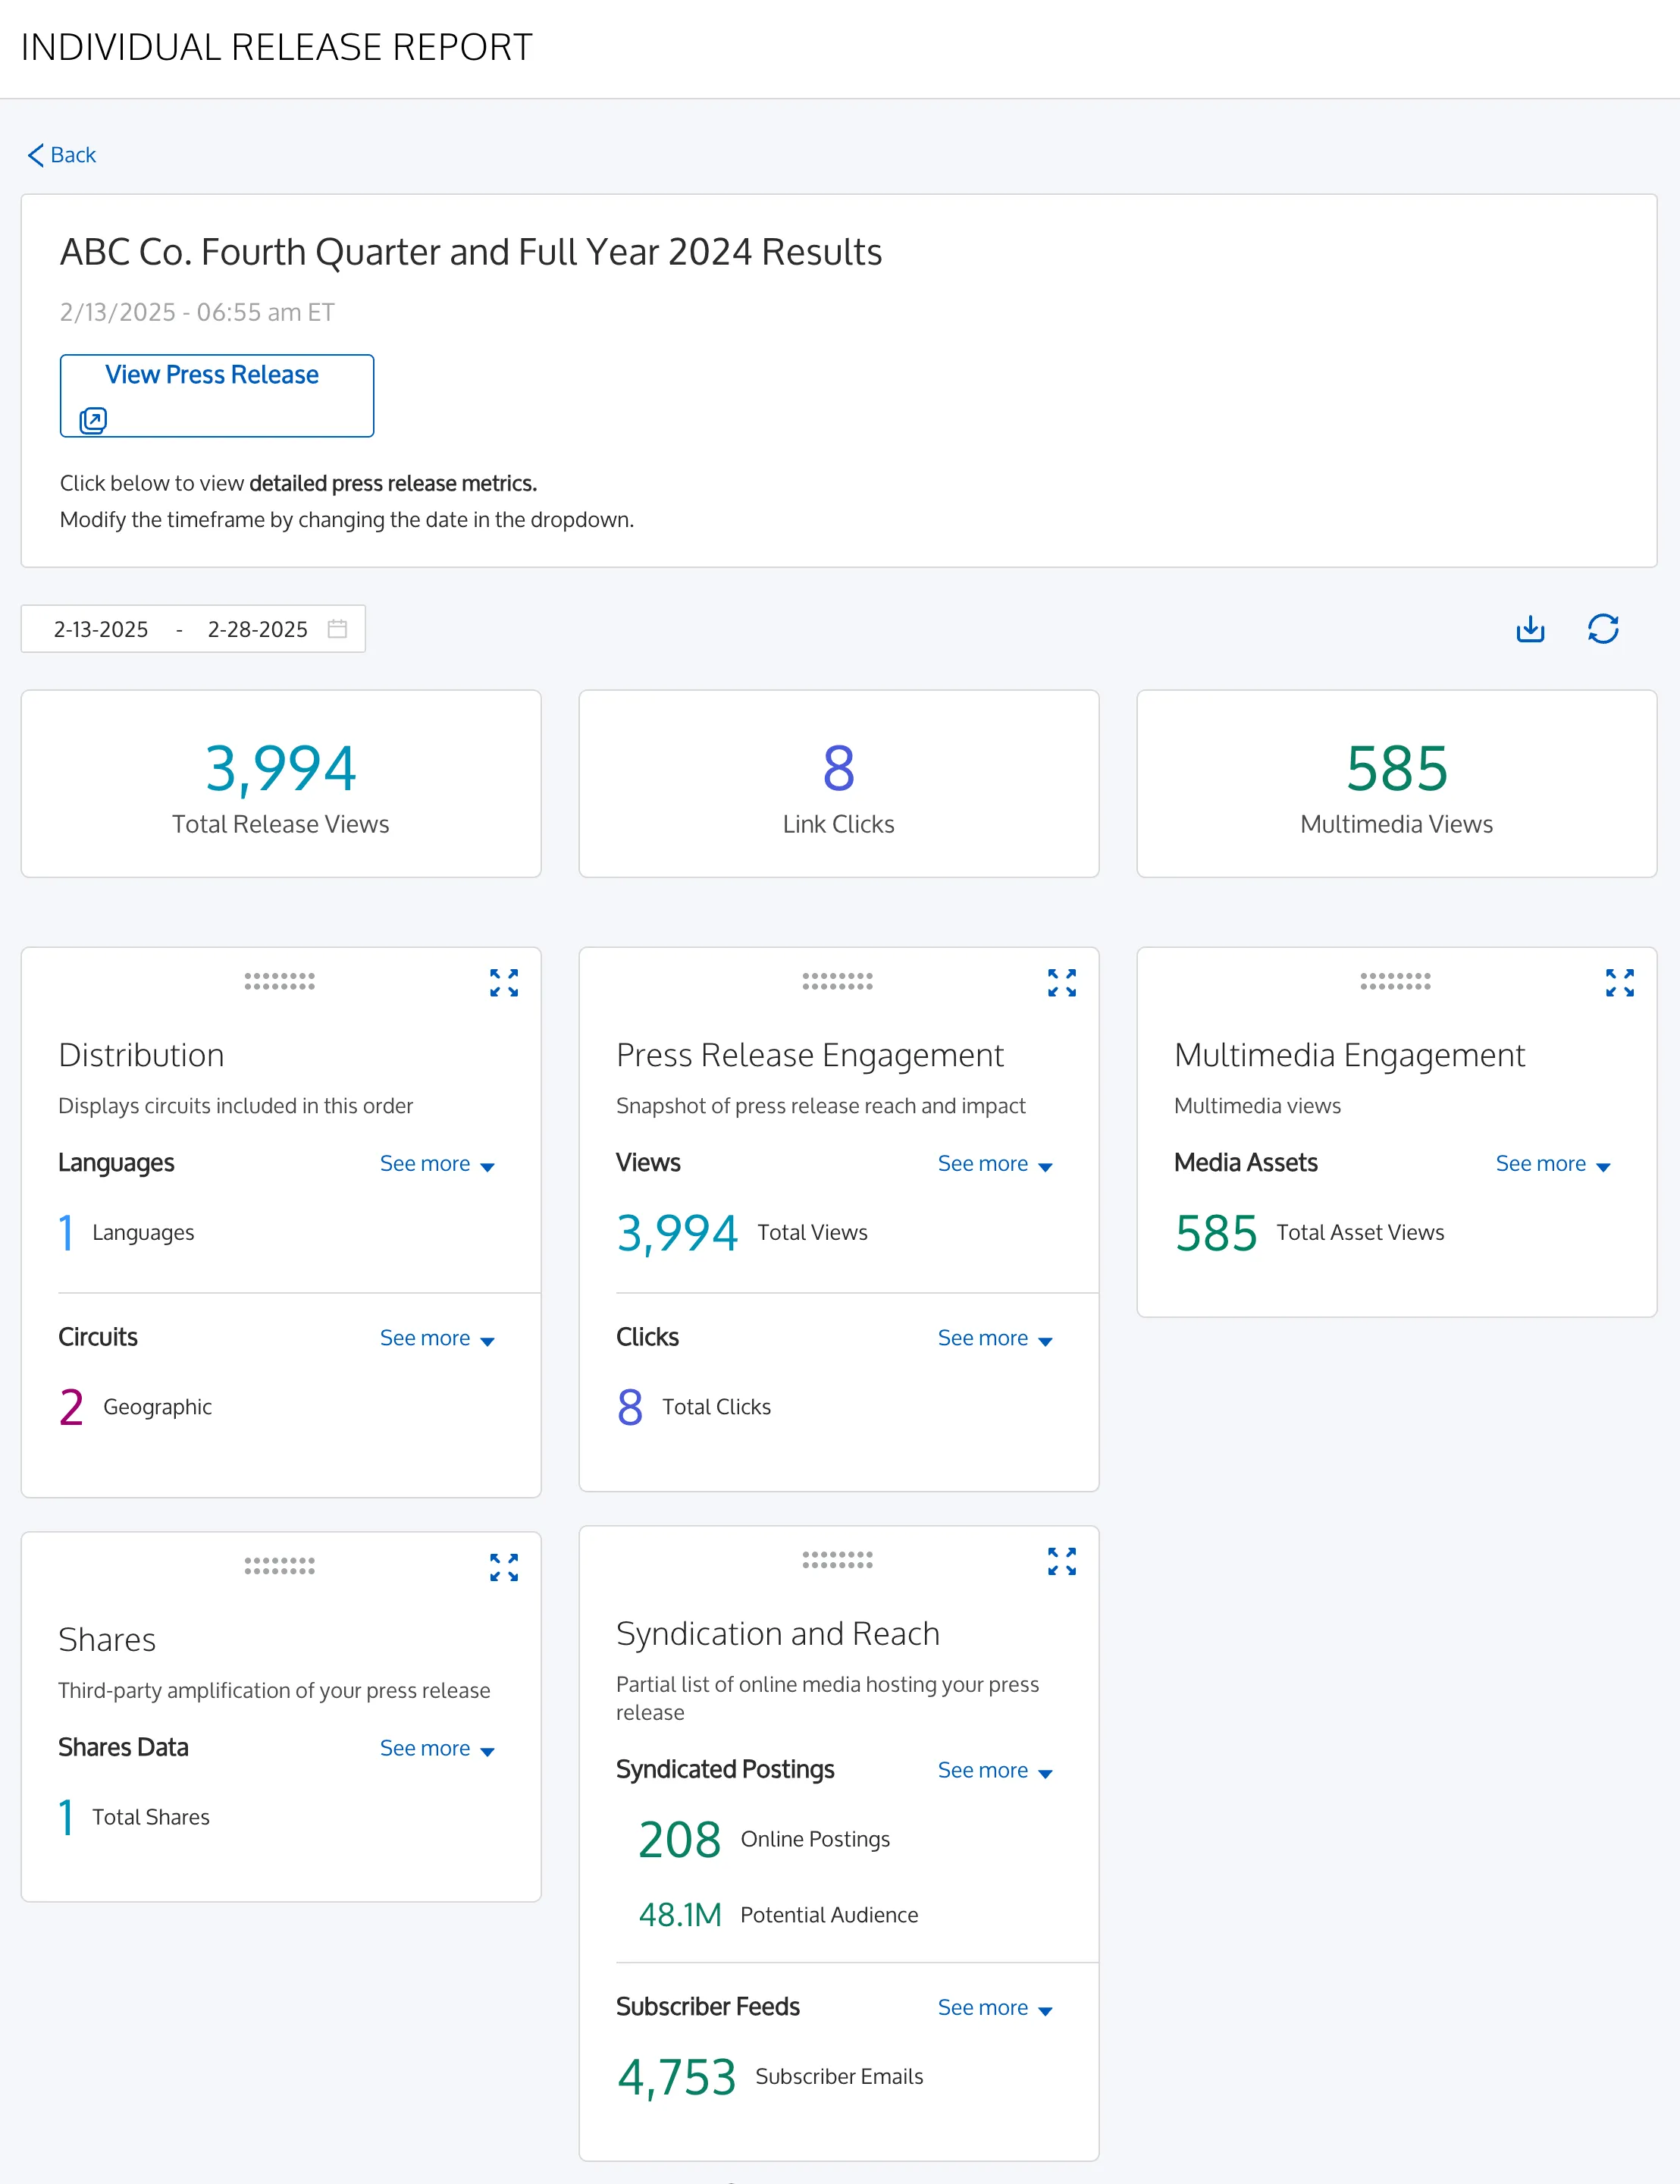
Your press release’s NewsTrak Report will look something like this. Let’s learn more about organizing a NewsTrak Report to suit your preferences, how to view more detail, and what each section entails.
Key Metrics

At the top of the report, three boxes contain key, high-level metrics.
The three metrics displayed depend on what data is available for your press release. These data points are also available elsewhere in the report.
Metrics that may be displayed include: Total Release Views, Link Clicks, Multimedia Views, Online Postings, Shares, Estimated Audience Reach.
Learn more about NewsTrak Report data points.
Viewing Report Data
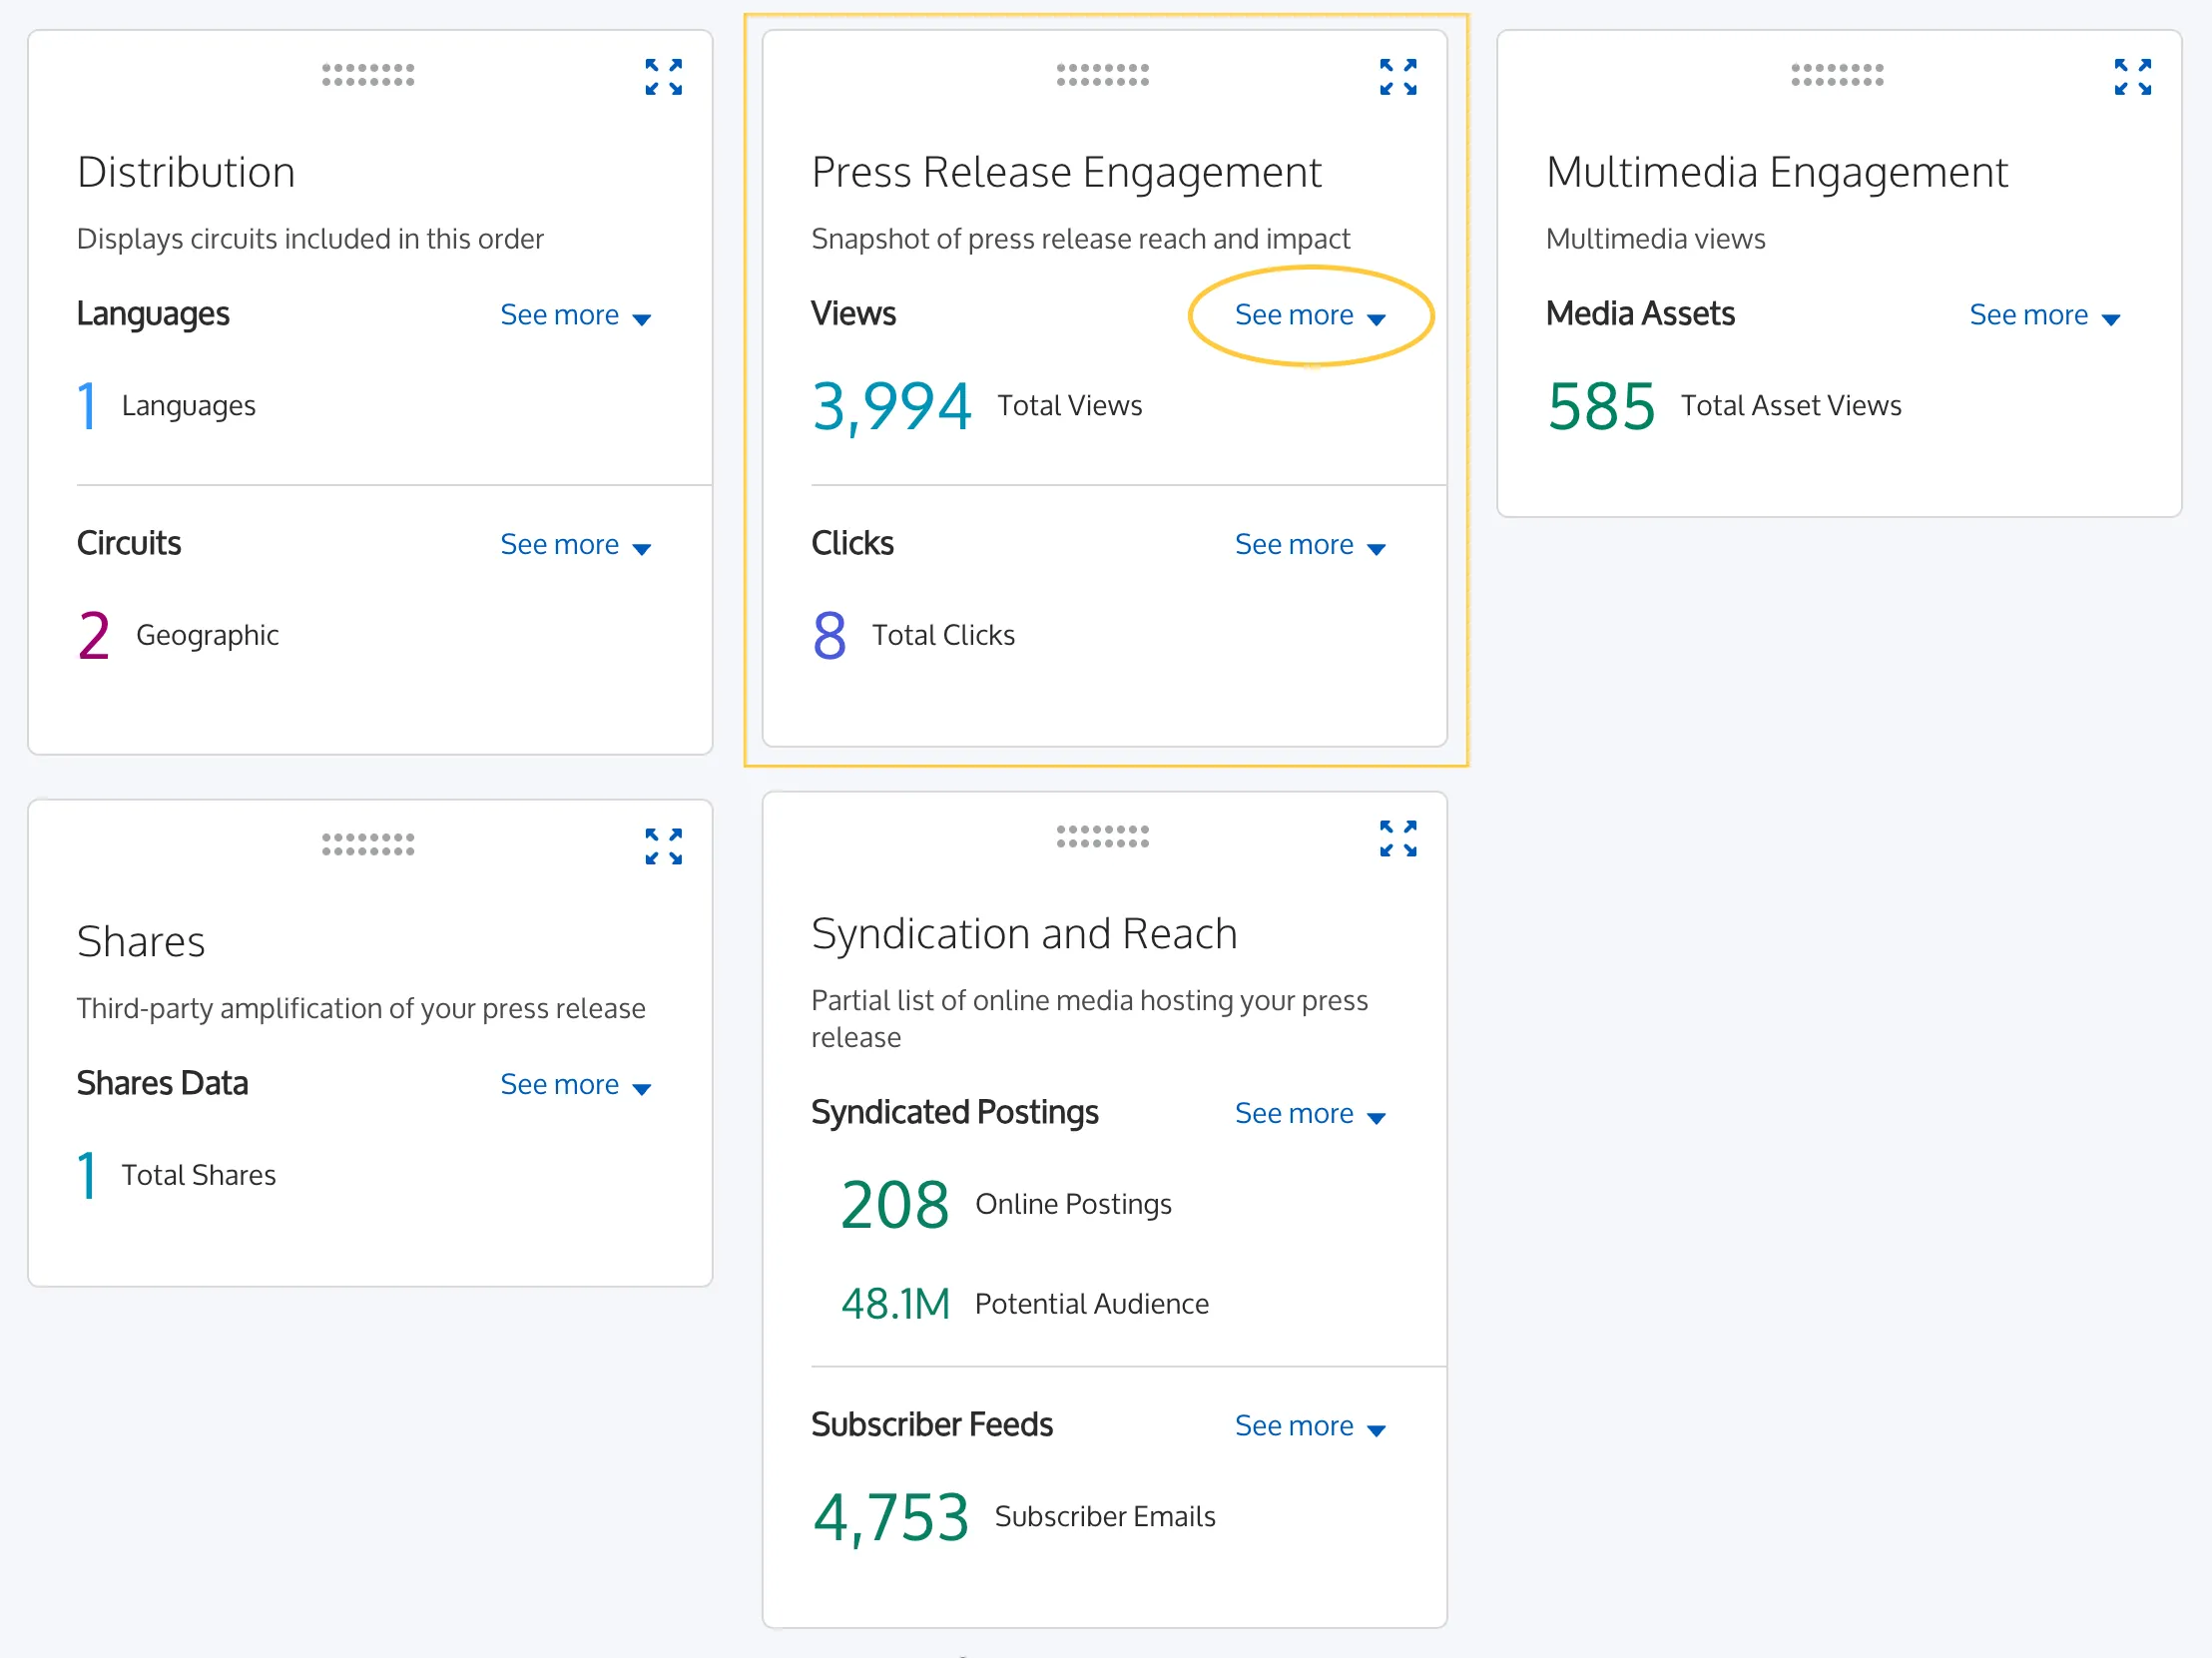
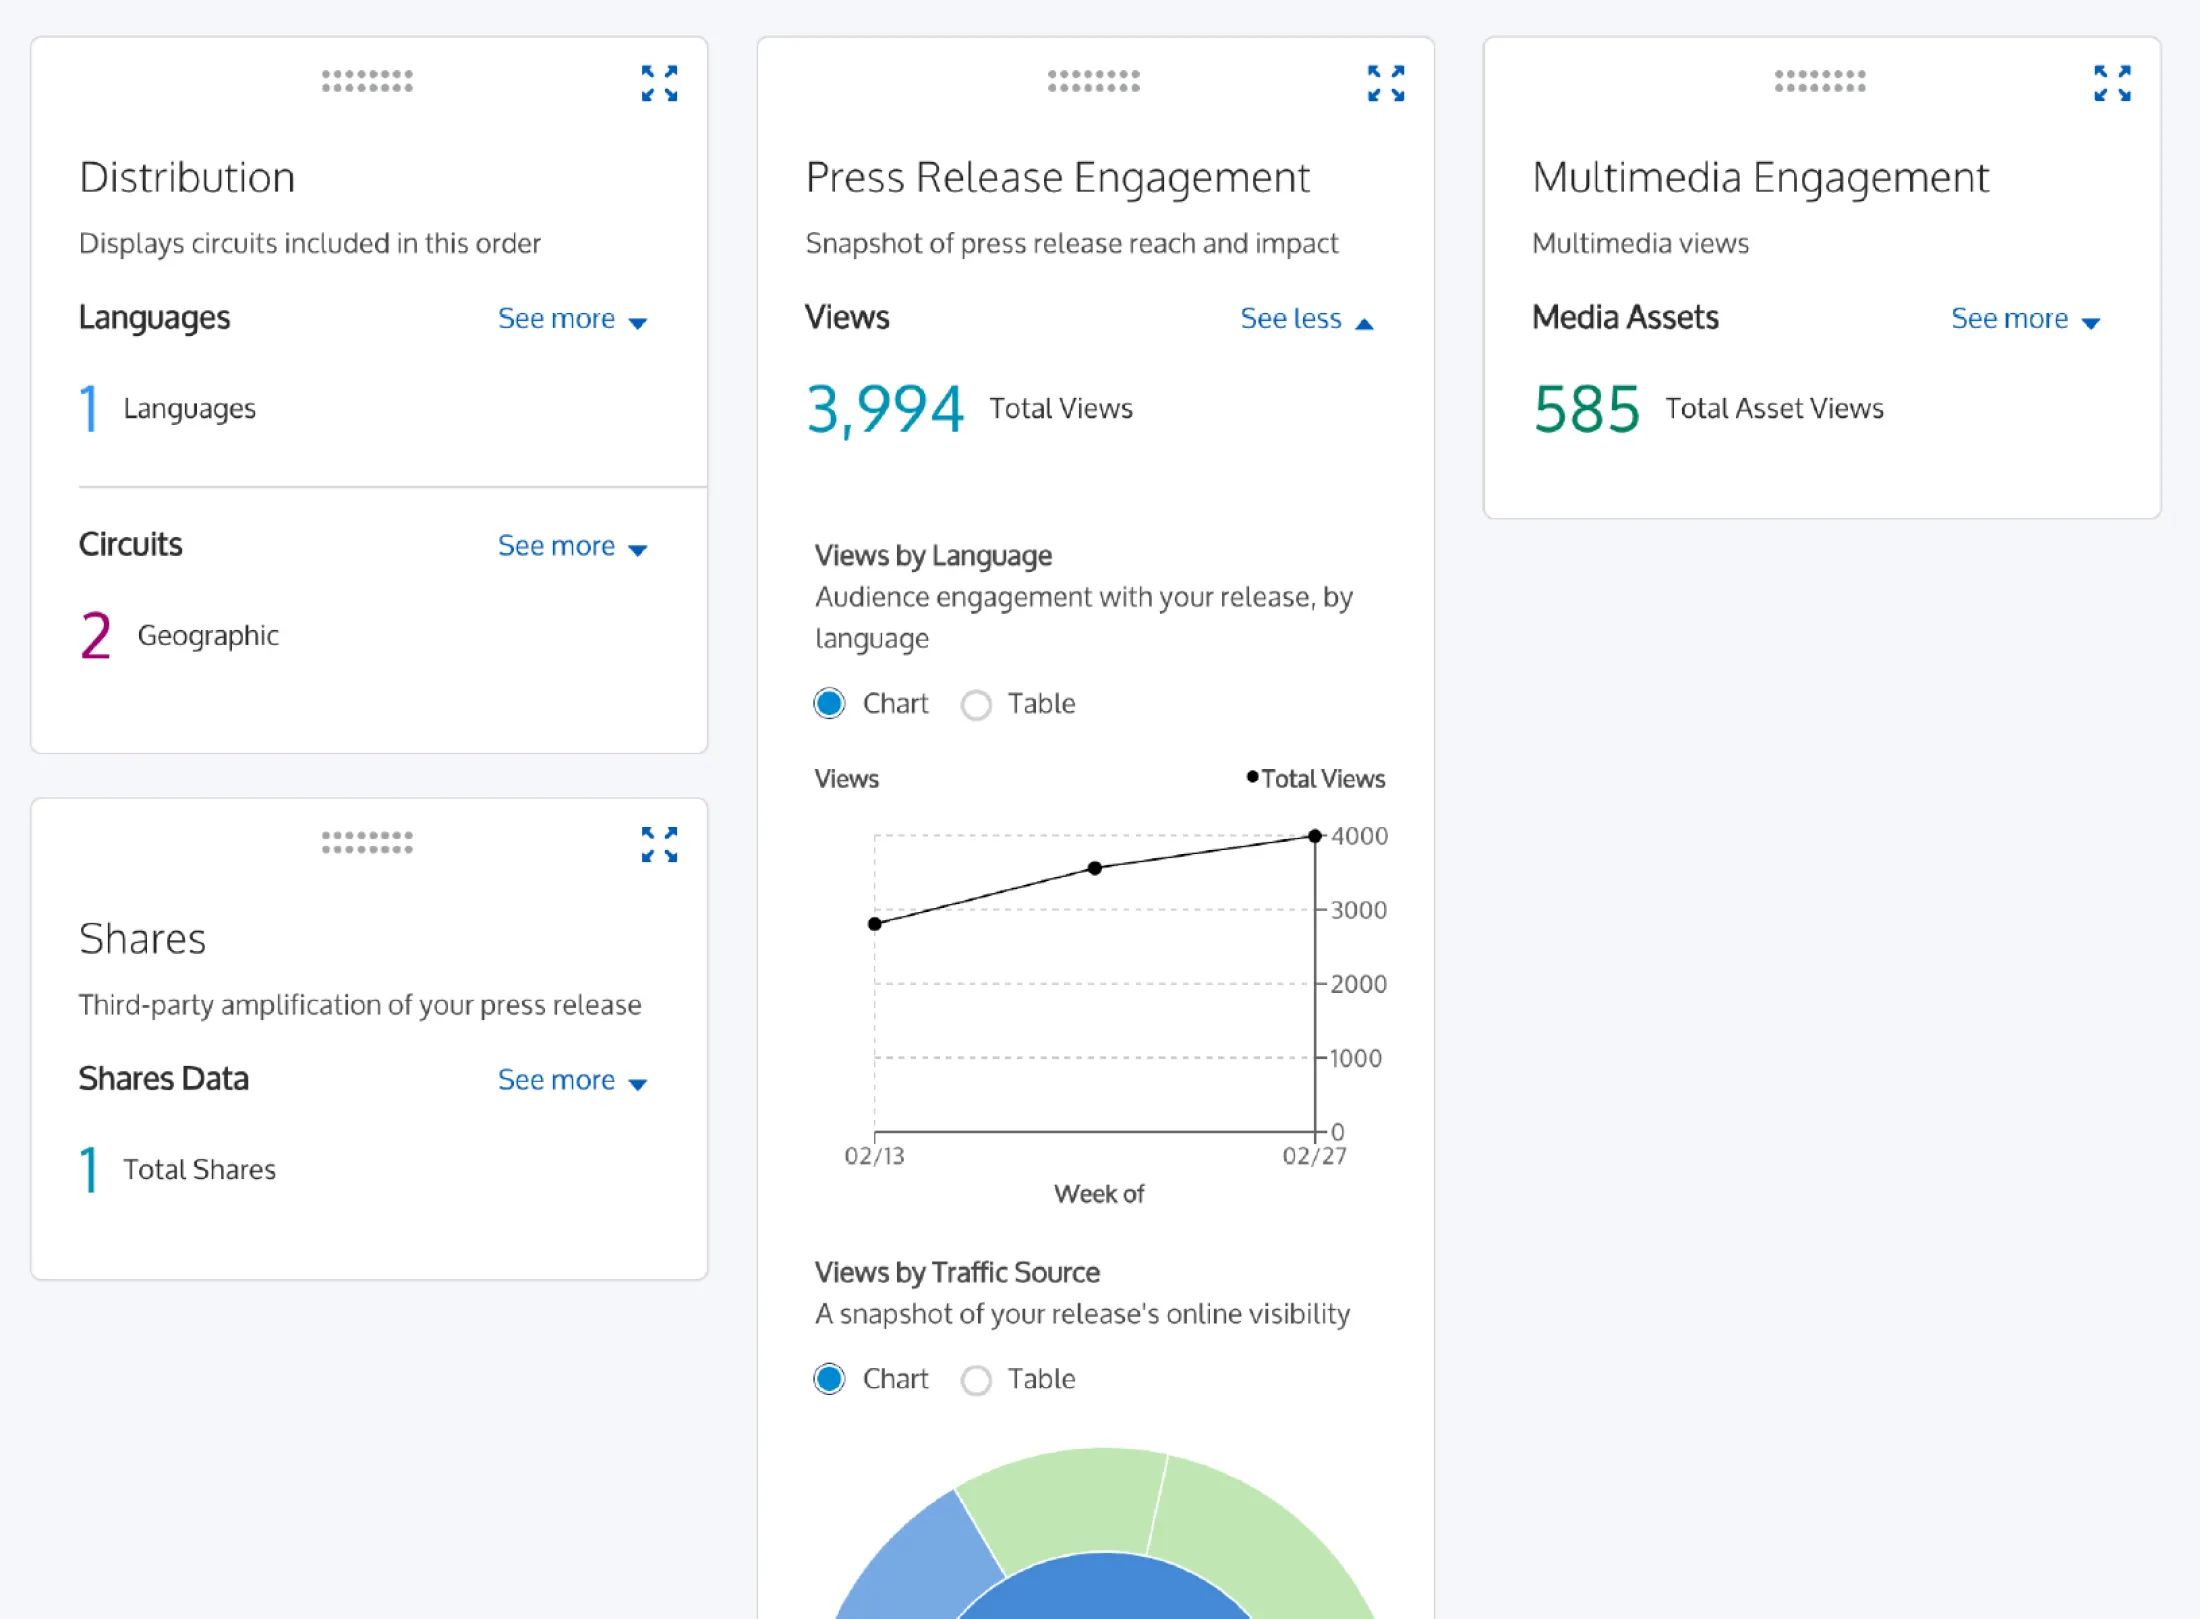
NewsTrak Reports are comprised of sections. Each section contains different press release performance and distribution analytics. By default, each section will be minimized, with only key data points displayed.
Click "See more" within each section to view more detail. Click "See less" to collapse the section.
Only one dataset within a section can be set to “See more” at a time.
Customizing Your Report Layout
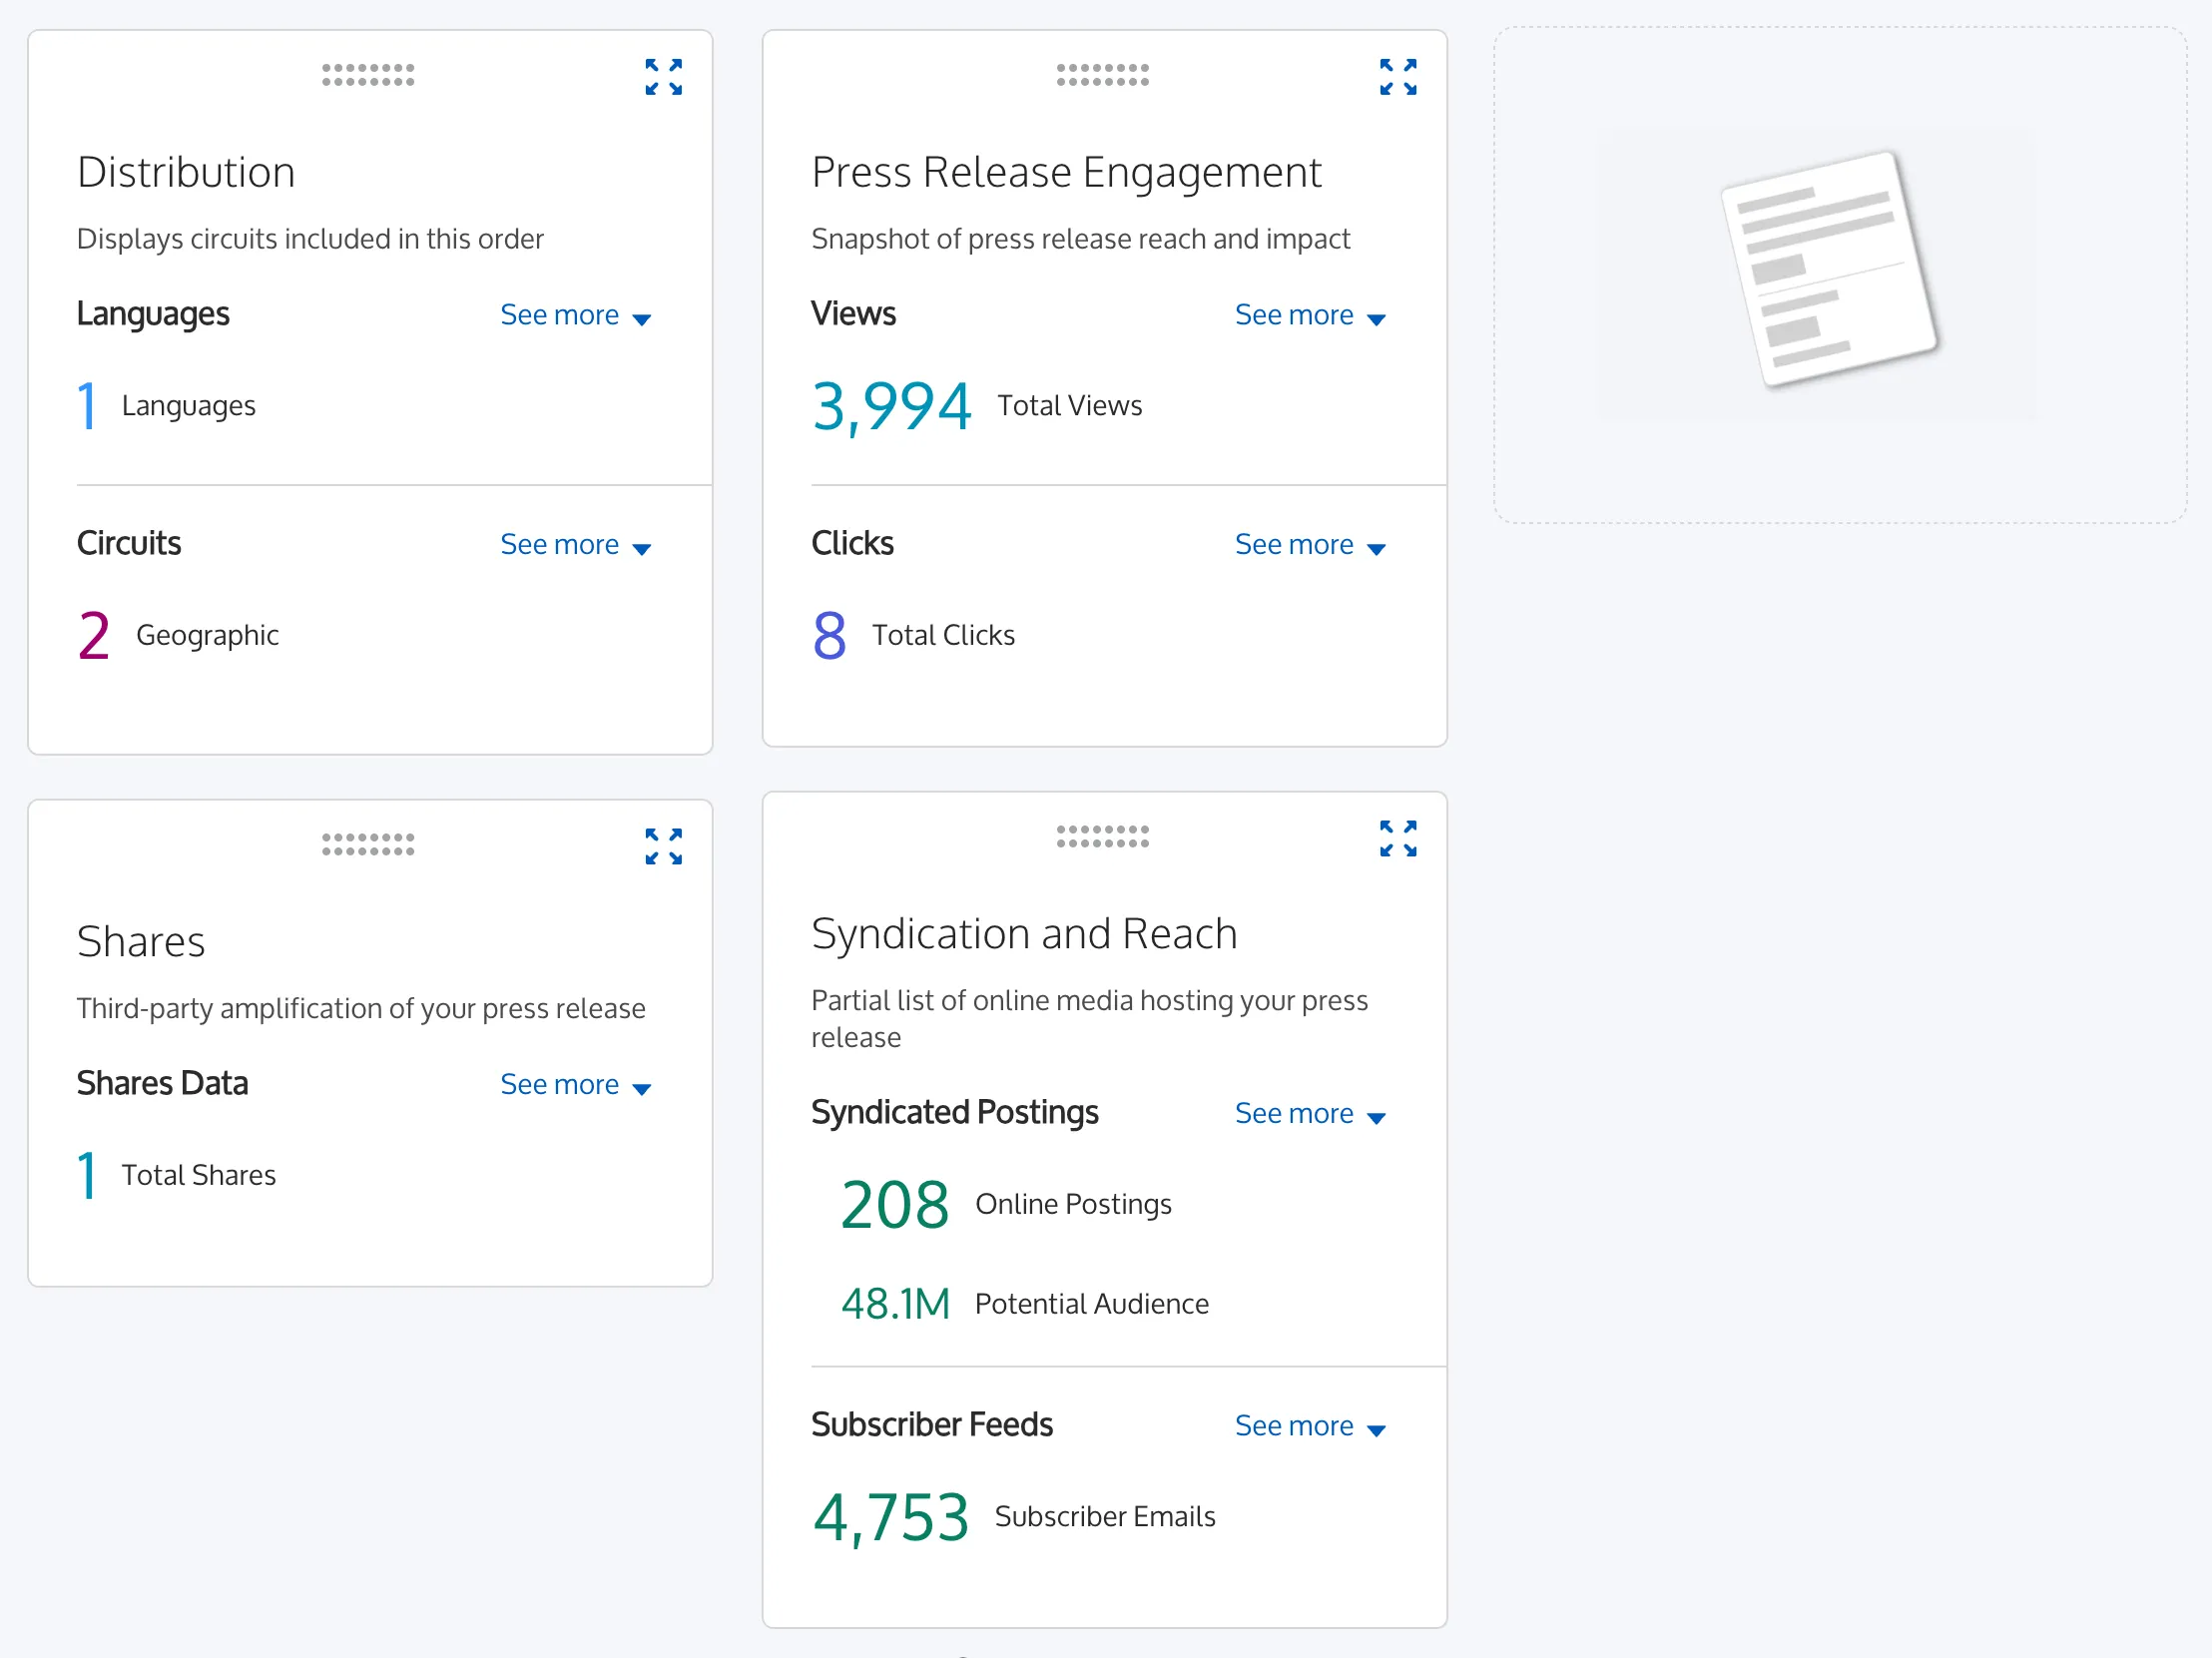
Each section in your NewsTrak Report can be arranged (grab, drag, drop) according to your preferences. Once the sections are arranged to your liking, a “Save” banner appears at the top of the screen.
Saving applies the arrangement for all NewsTrak Reports viewed under the same account login. Other users on the same account will not be affected and can set their own arrangement.
Expanding a Section
The "exploding arrows" icon at the top left of each section allows you to expand the entire section into a popped-out view to see a larger, more detailed display. The expanded view of a section contains a download link to export the data for that specific section into an Excel or PDF file.
Data Visuals
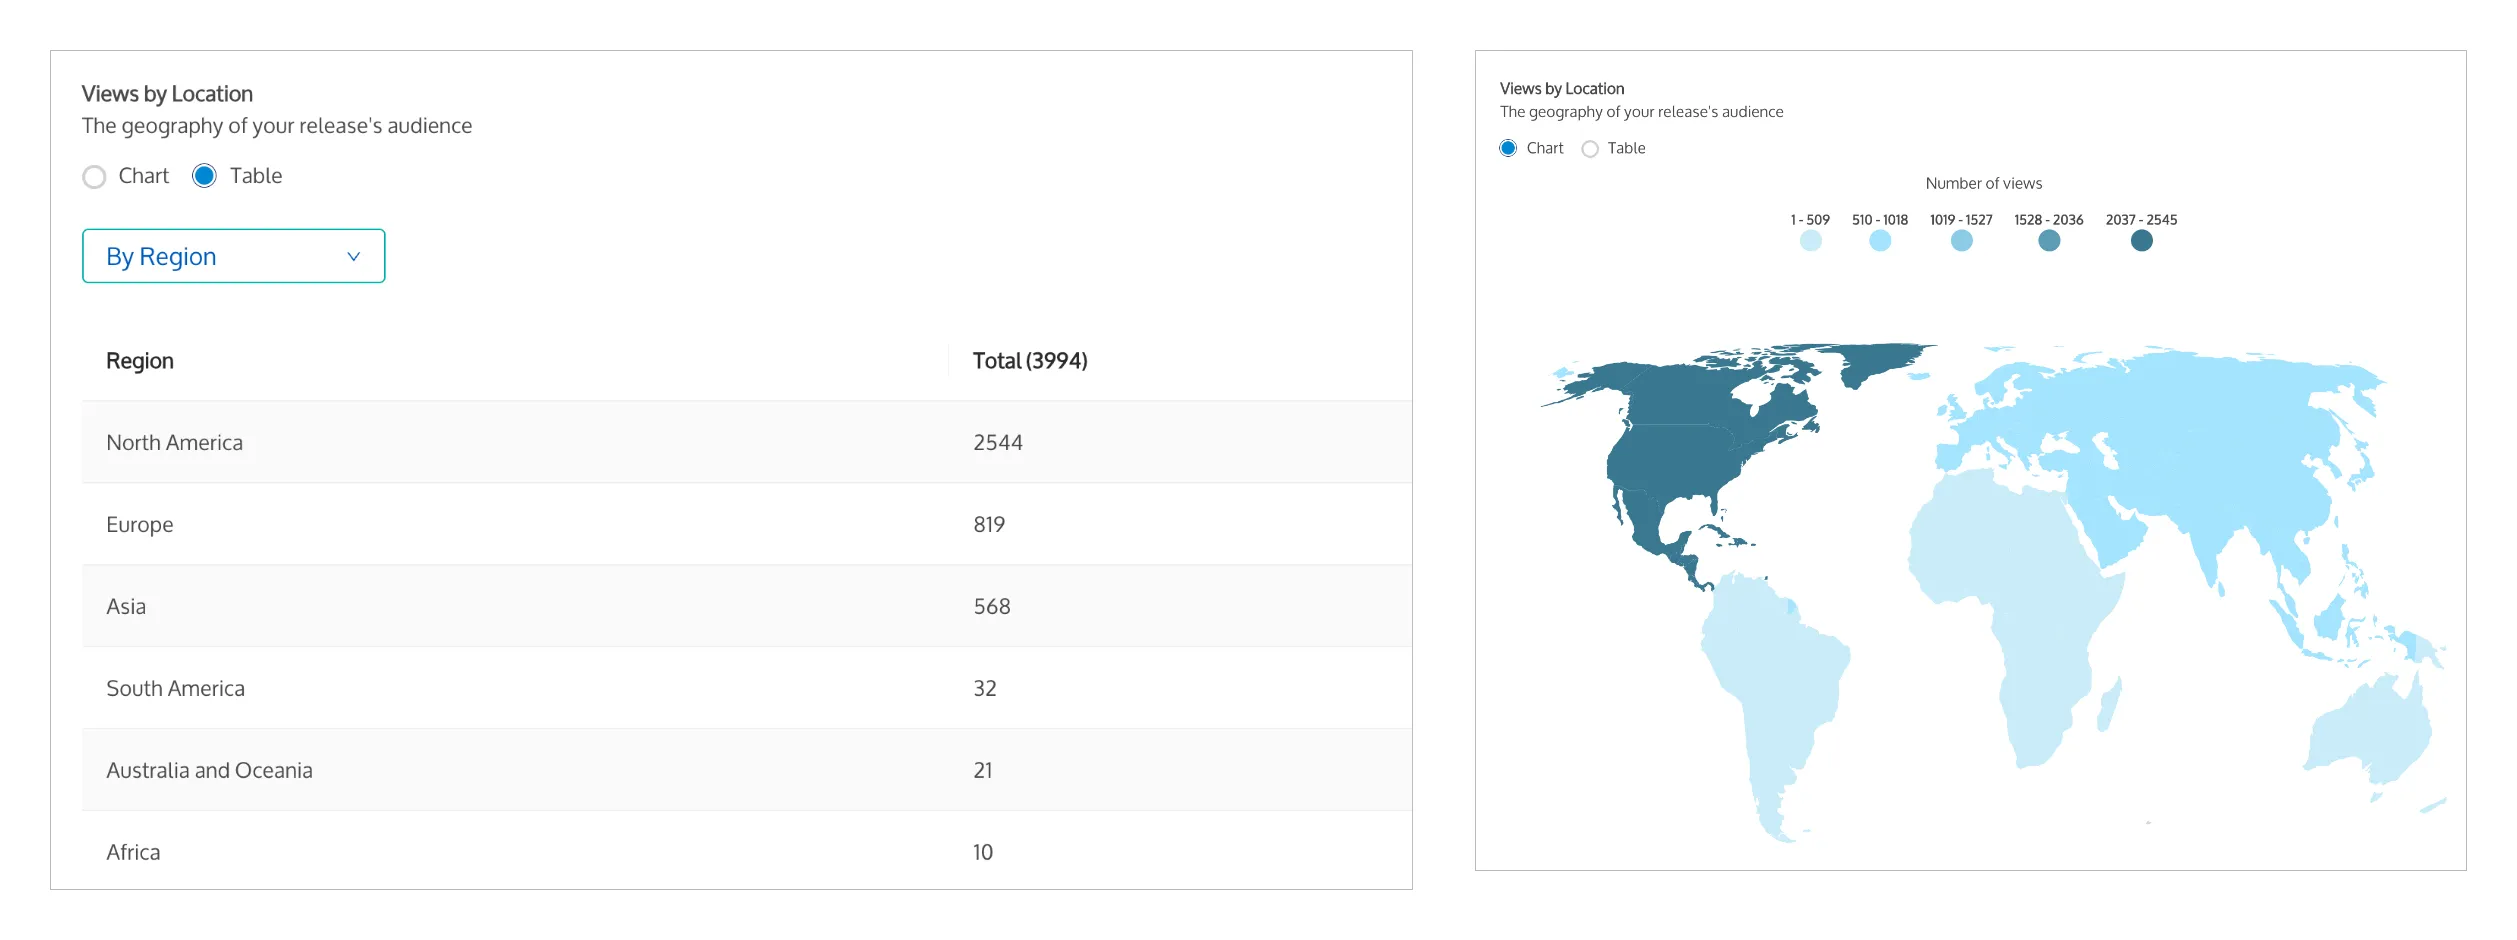
Data within most sections can be viewed in chart (graphs, pie charts, maps, visual logo display) or table formats.
In "Chart" view, hovering over a graphic will trigger a pop-up with more details.
In "Table" view, a maximum of five lines appear at a time. If there are more than five lines of data, click through the pages by clicking "Next" below the columns. If the number of columns of data available is more than fits on the screen, scroll to the right to view that data.
Using the Date Picker
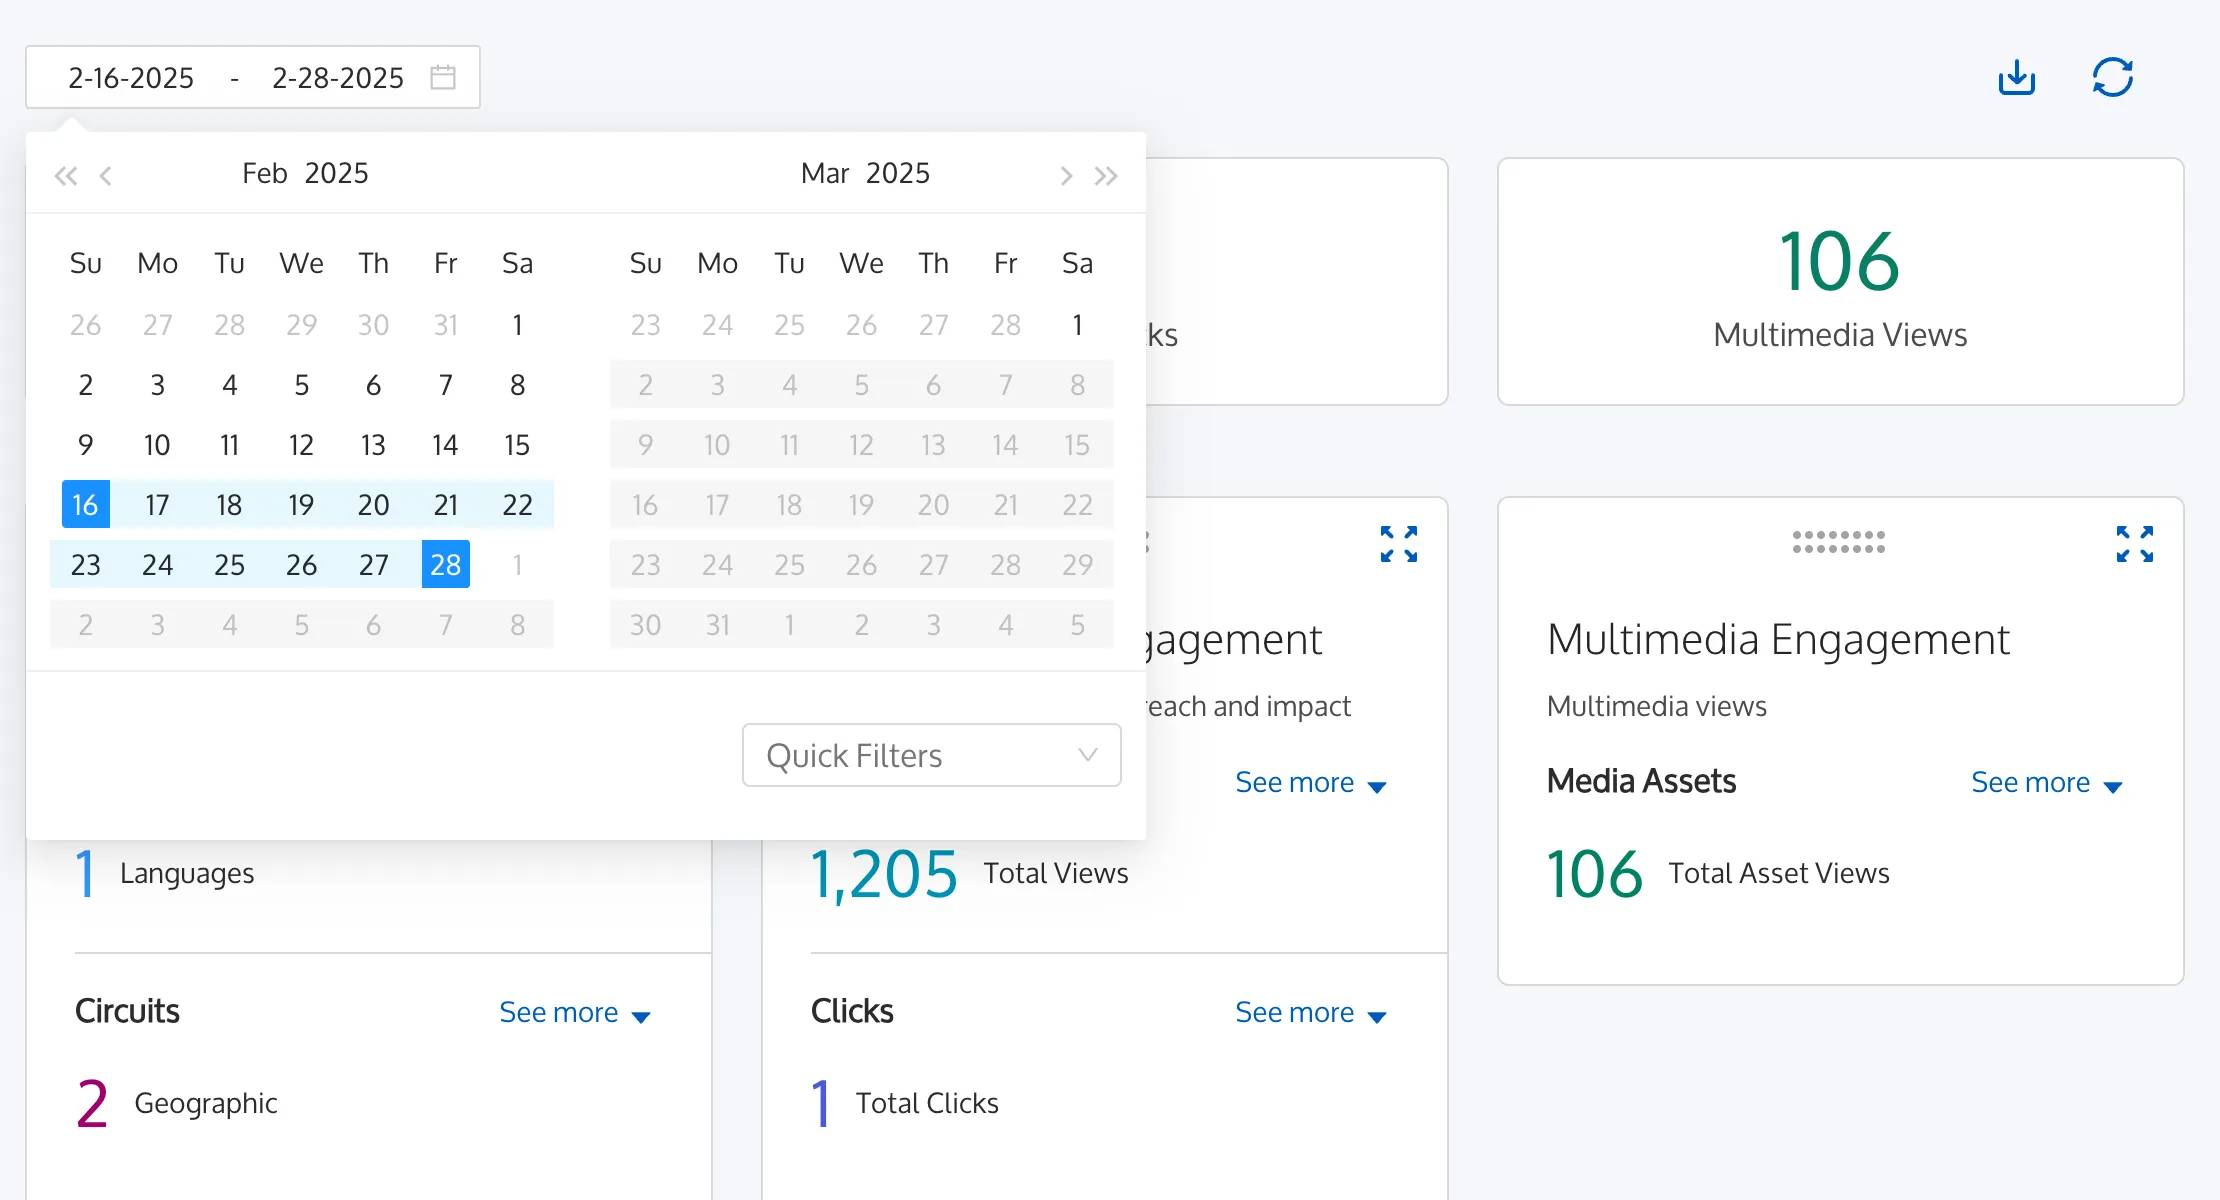
The date picker can be used to view press release data for a custom range of time. The default date range is from the date of distribution to the current date.
Click the date range to open the date picker. Select dates on the calendar, type specific dates, or use one of the Quick Filters.
Quick Filters change as your press release ages; not all options may be visible. If a press release is less than a week old, only "First 24 hours" and "Life of Release" will be visible.
All report sections except the Distribution section will reload and update to reflect the specified date range.
Downloading NewsTrak Reports
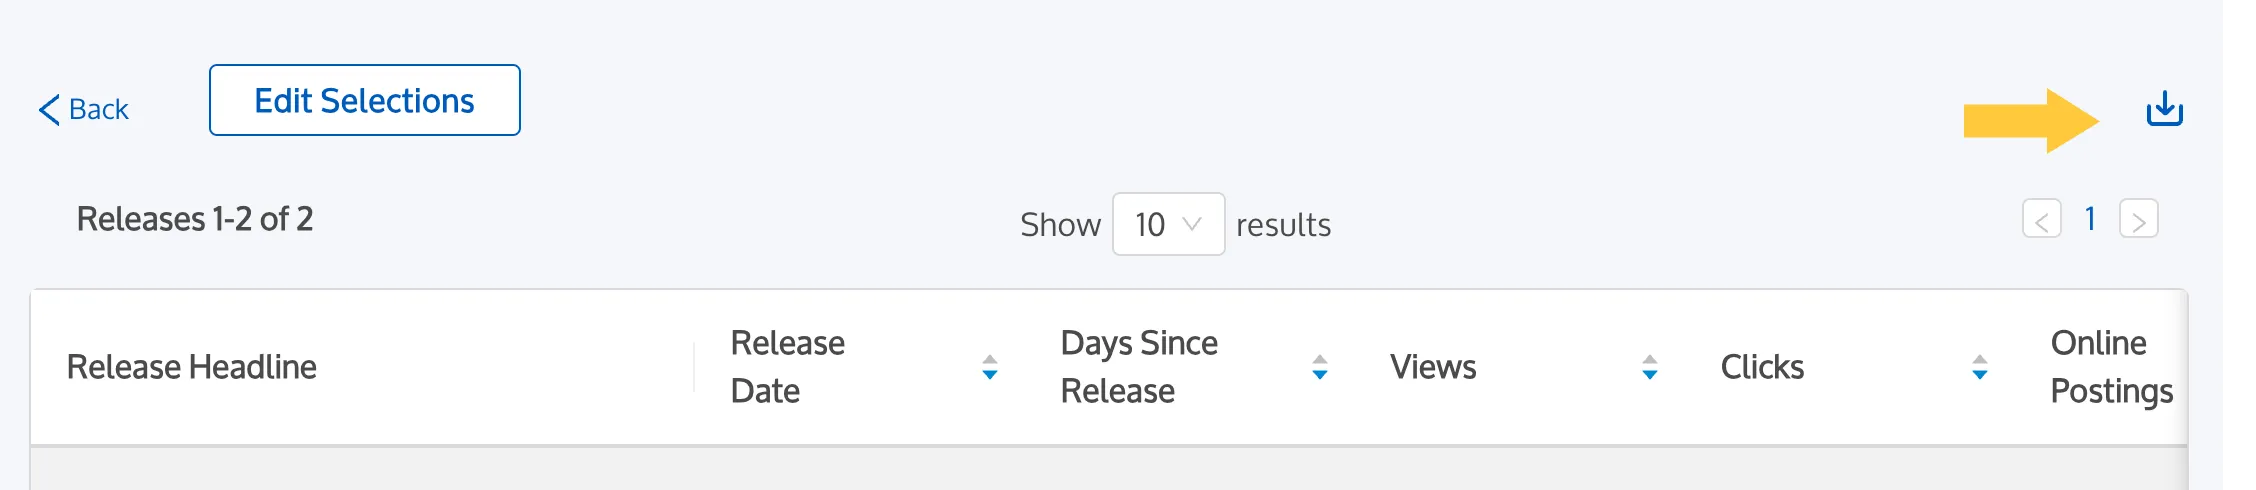
NewsTrak Reports can be downloaded as either an Excel document or PDF file using the download icon. To download the full NewsTrak Report, click the download icon on the NewsTrak Report page (upper right).

If you'd like to download information for a single section, expand the section and click the download icon within the popped-out view.
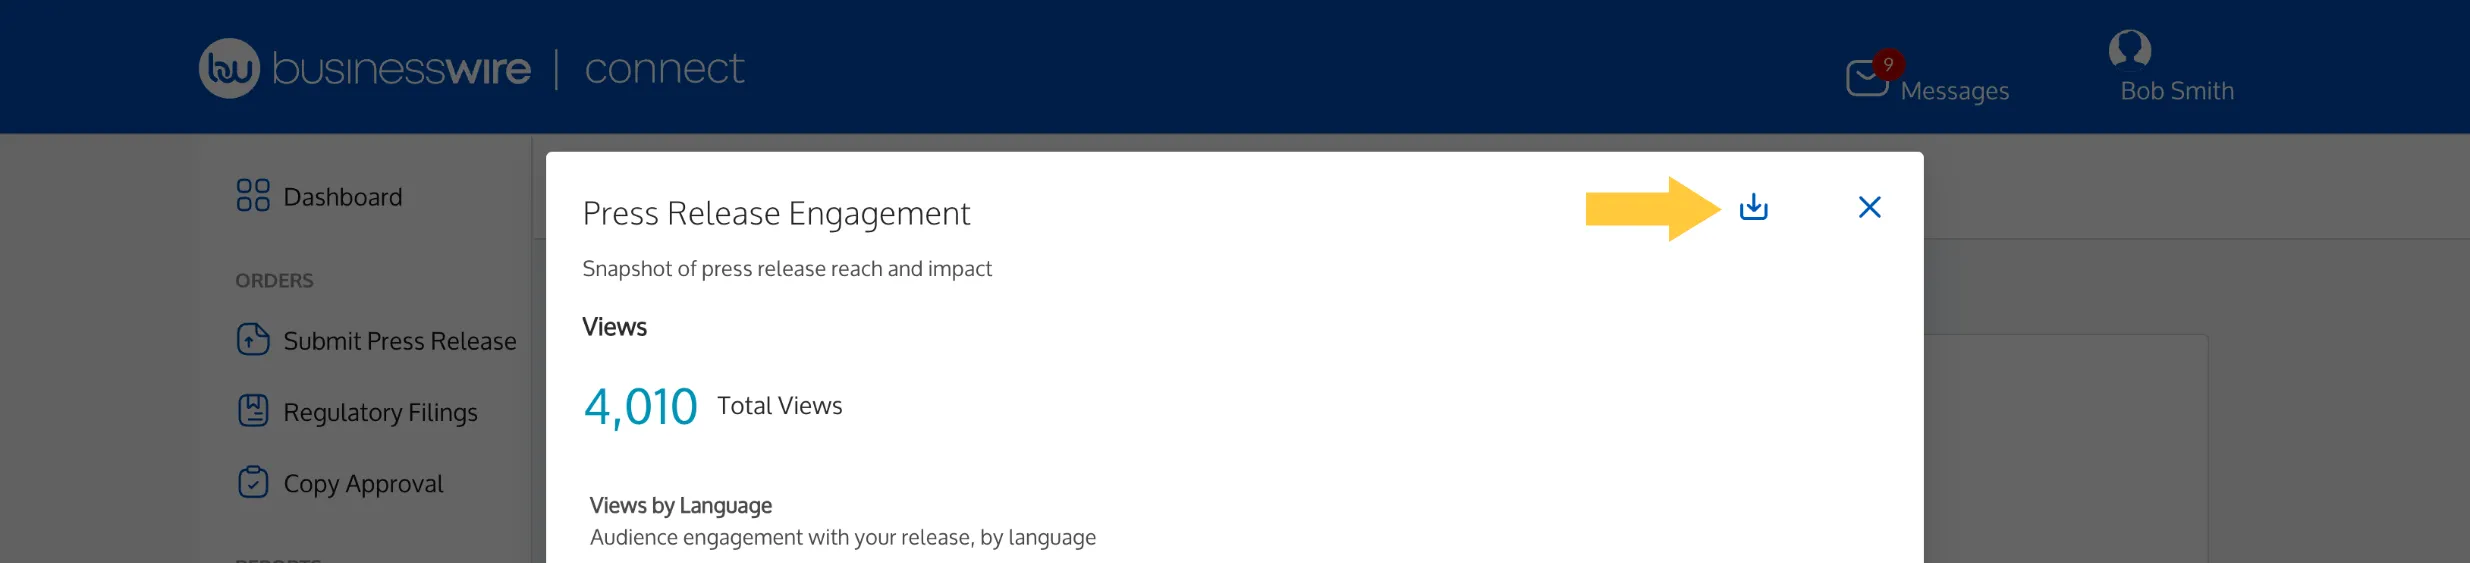
To download a Report Comparison, click the download icon on the results page of your compared reports.
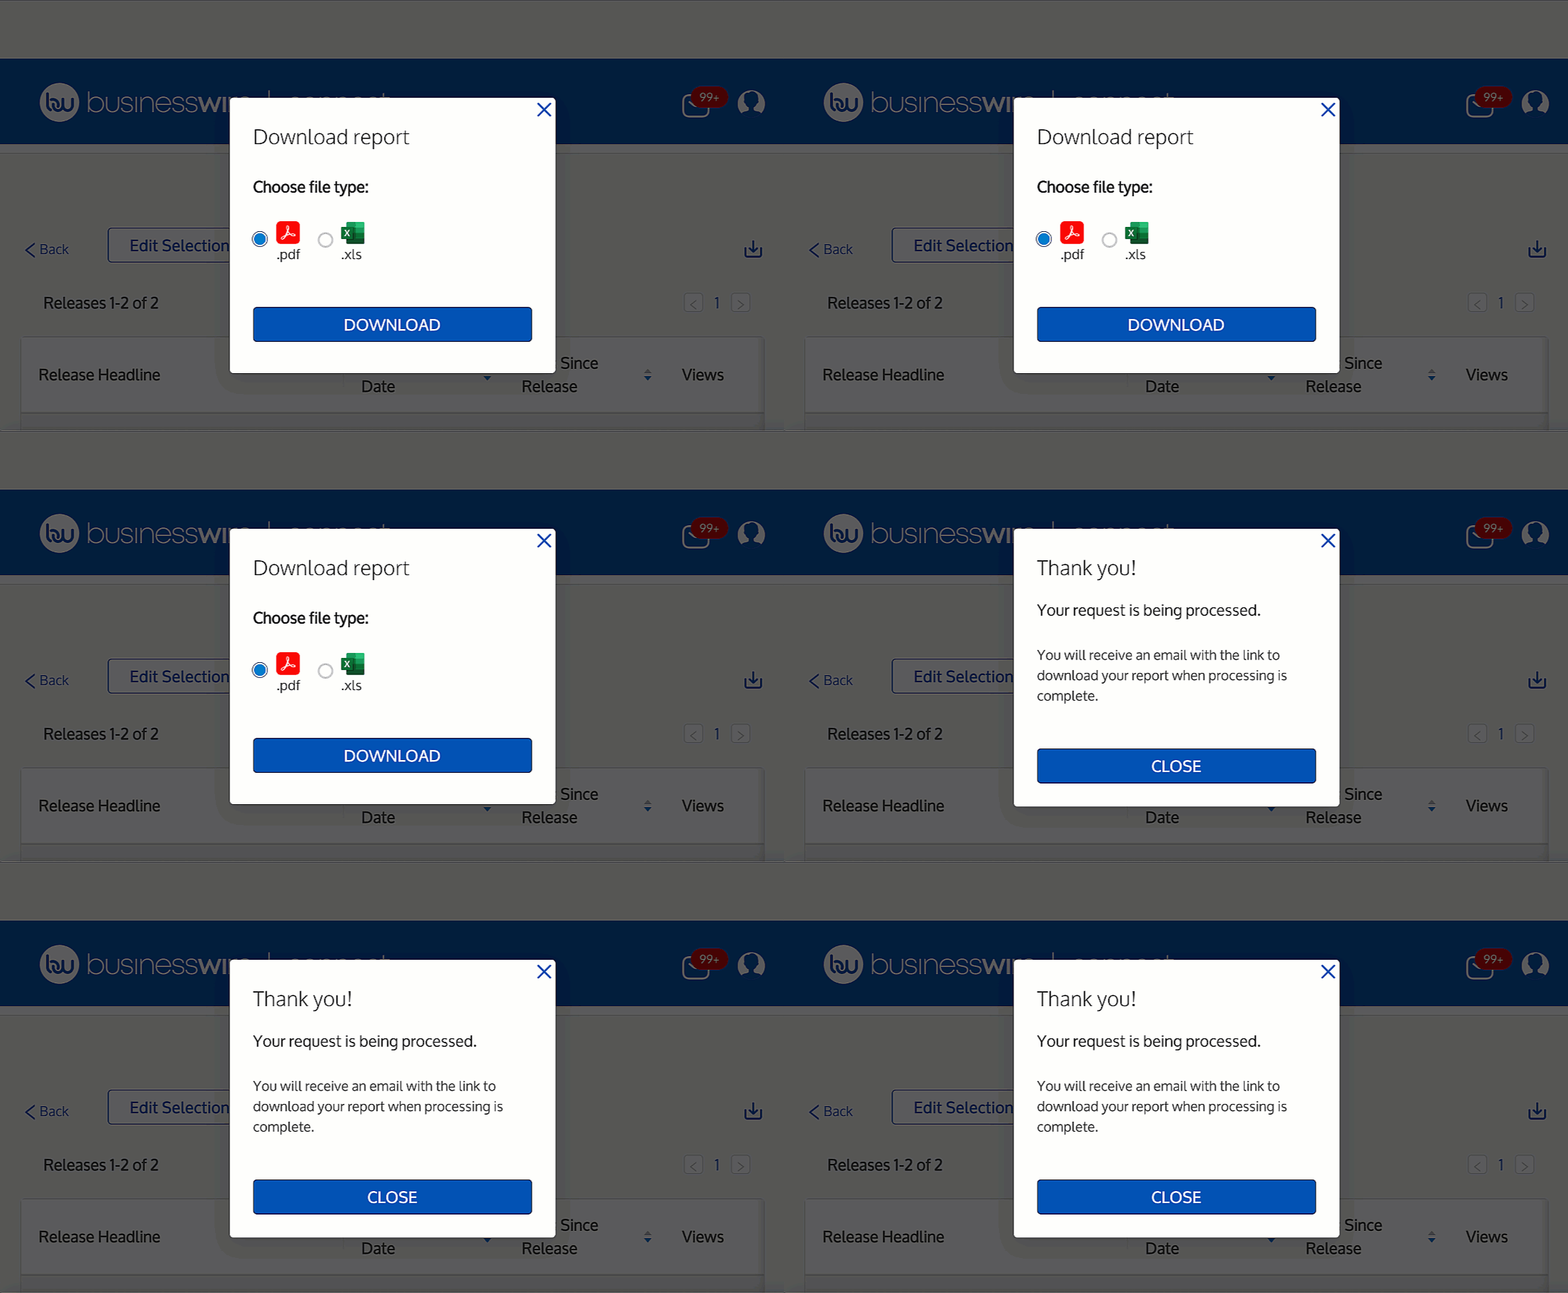
Once you've clicked the download icon, a pop-up window will appear prompting you to select your preferred format (Excel or PDF). Select your preference, click "Download," and a message will appear confirming your request. Click "Close."
You'll receive an email and Message Center message with a link to the download file once it is complete. Click the link, log back into Connect, and the file will automatically download.
Understanding NewsTrak Reports
Key Metrics
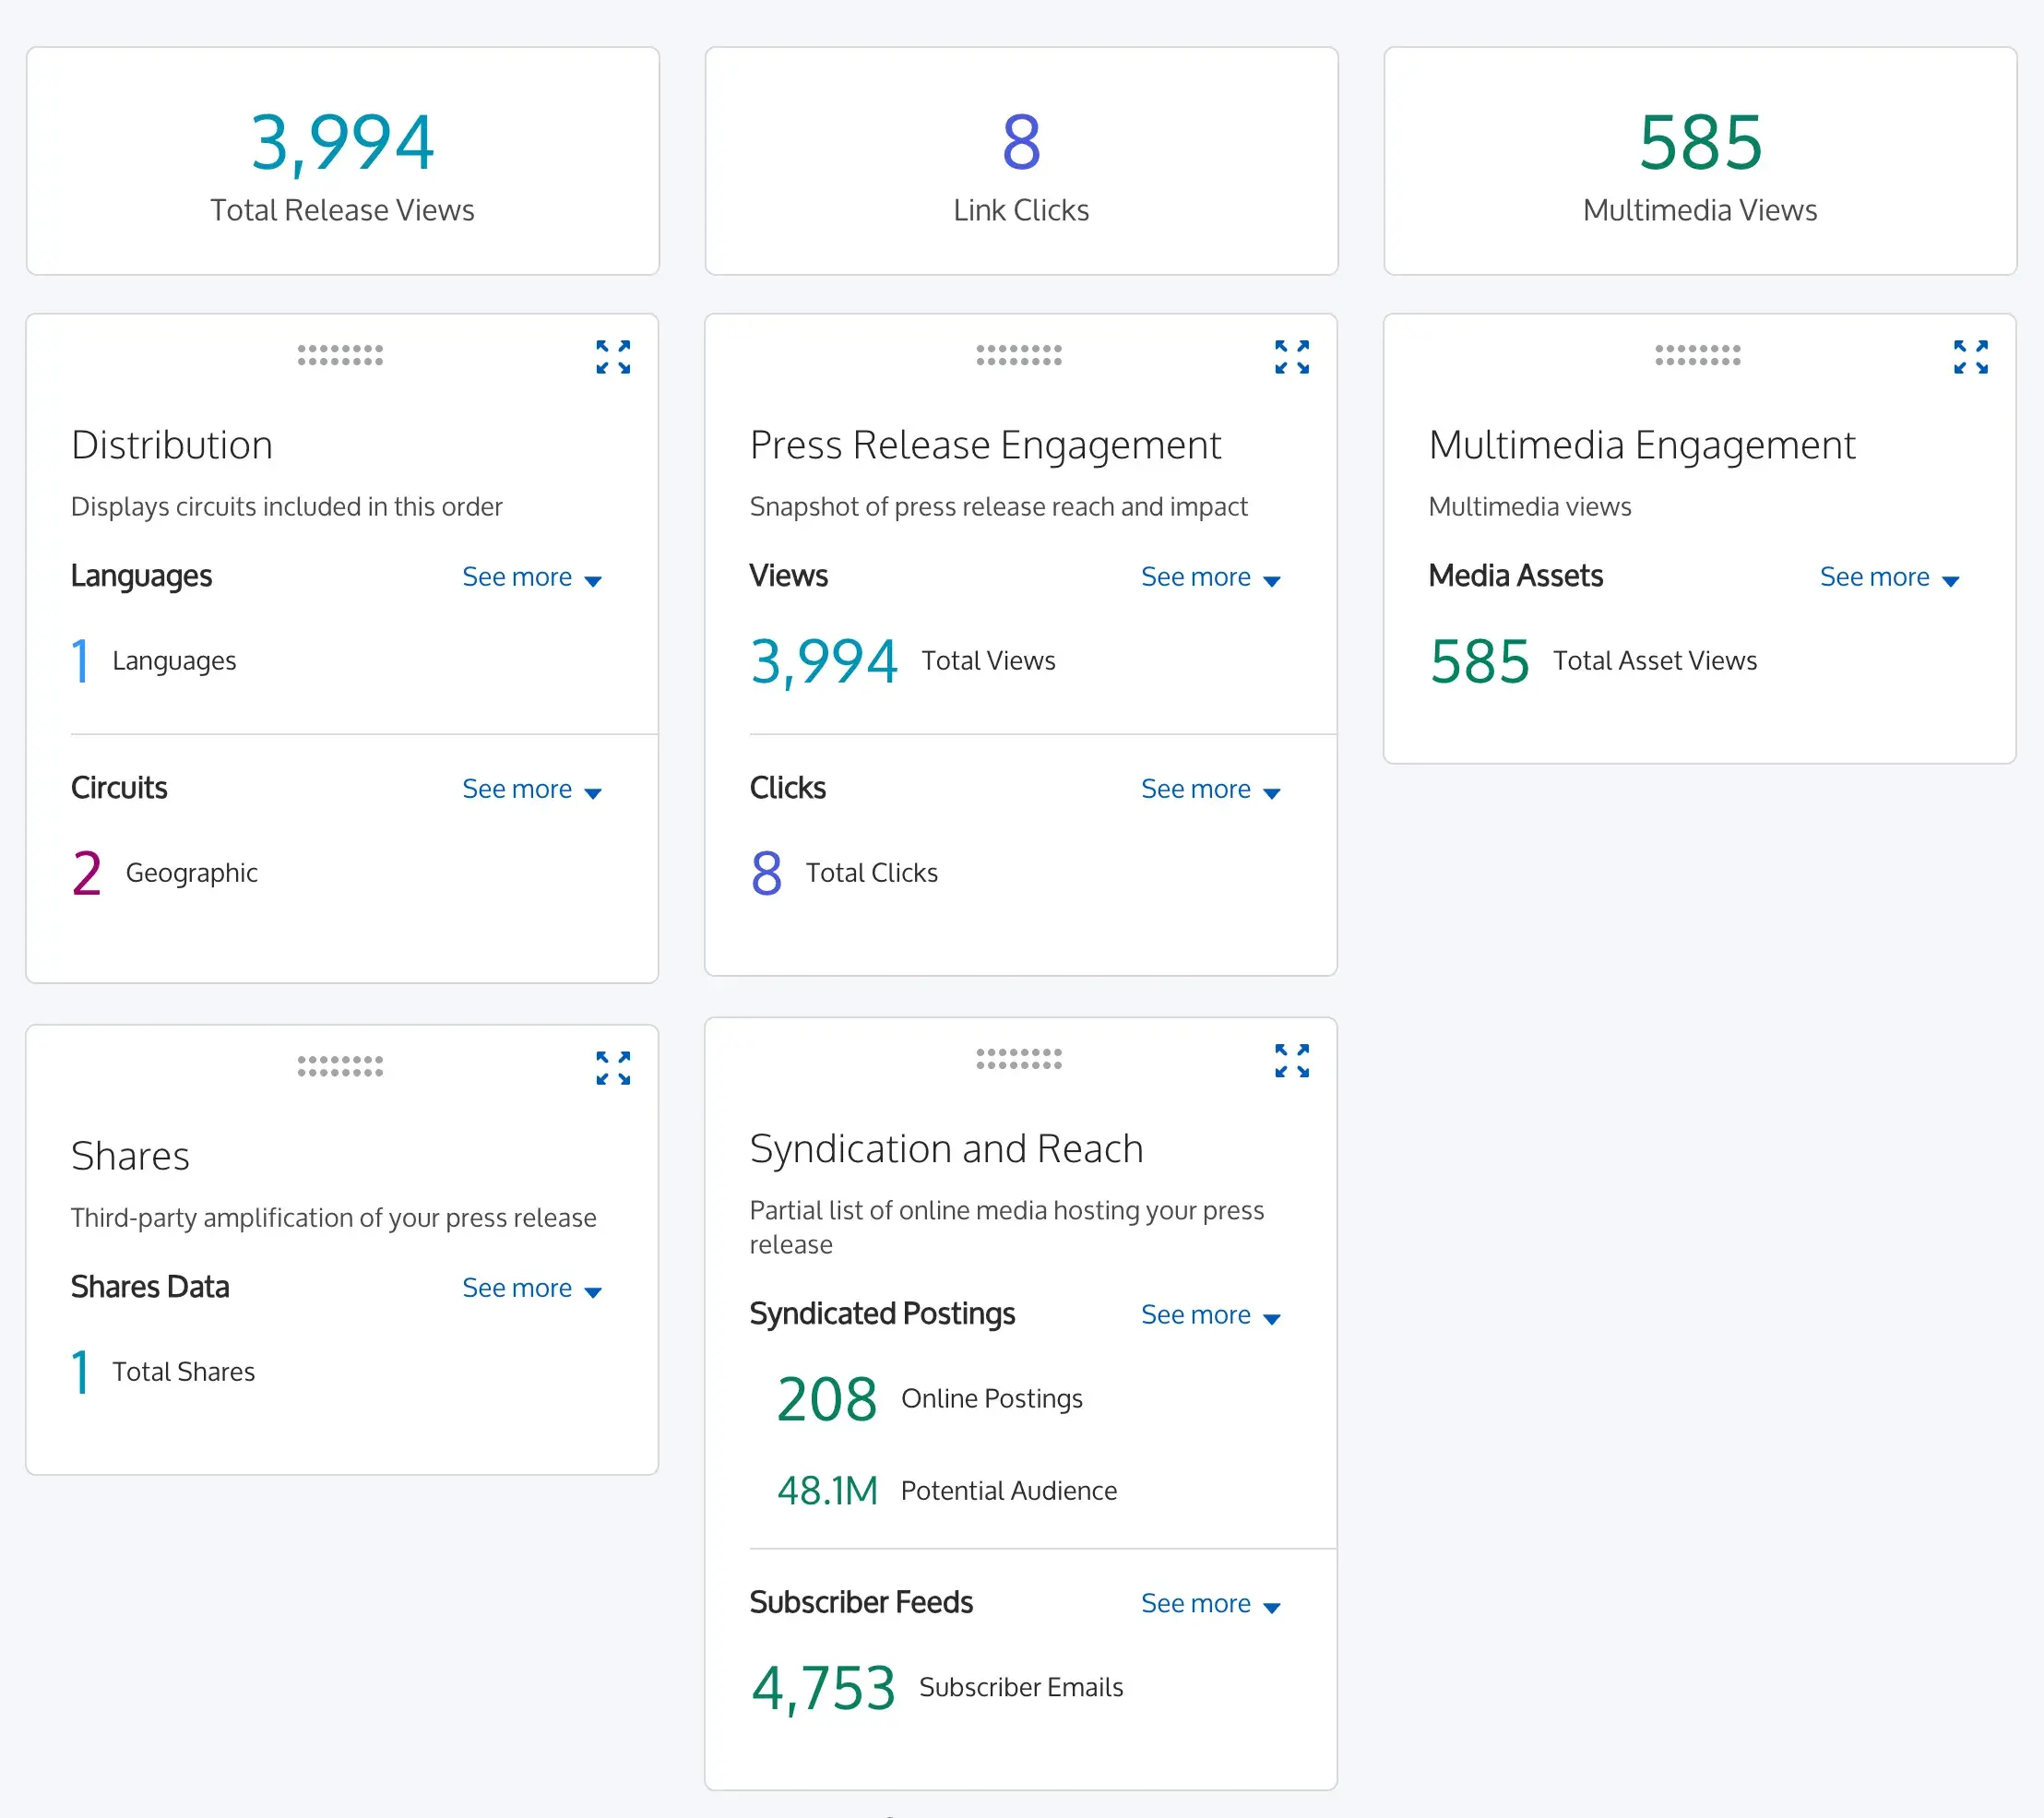
The three high-level metrics displayed depend on what data is available for your press release. Each of these data points is also available elsewhere in the report:
- Total Release Views: Total views of your press release on BusinessWire.com and external sites.
- Link Clicks: Total count of interactions with the links embedded within your press release.
- Multimedia Views: Total count of views of any non-text assets distributed with your press release including images, videos, logos, and more.
- Online Postings: Total number of sites where your press release was posted.
- Shares: Total count of third-party sharing of your press release.
- Estimated Audience Reach: The estimated traffic (measured by unique visitors per month) to websites that have confirmed postings of your press release.
Distribution
This section displays the languages and circuits included in your press release order.
- Languages: A count and list of the languages your press release was issued in.
- Circuits: A count and list of the distribution lists selected for your press release.
Press Release Engagement
This section displays view and click data for your press release.
Total Views: A count of all views of your press release on BusinessWire.com and external sites.
Views by Language: The number of views for each translated version of your press release.
Views by Traffic: A breakdown of views of your press release originating from Business Wire sites and external sites.
- Business Wire Sites: Direct traffic or views of your press release made on BusinessWire.com an Business Wire-hosted sites.
- Other Sites: Referral traffic or views of your release on BusinessWire.com that originated from another site.
Views by Location: The number of views of your press release based on geographic location.
Total Clicks: Total count of interactions with the links embedded within your press release.
Clicks by Link: A breakdown of link clicks per embedded link within your press release.
Clicks by Location: A breakdown of total link clicks per geographic location.
Multimedia Engagement
This section displays view data for any non-text assets distributed with your press release. This includes file types such as images, videos, audio files, logos, documents, spreadsheets, PowerPoint slide decks, and more.
- Total Asset Views: Total count of all asset views based on multimedia distributed with your press release.
- Asset Views: This table displays thumbnails of any assets distributed with your press release, the label given to the asset within Business Wire Connect, and a count of views per asset.
Shares
This section displays a detailed breakdown of third-party sharing data for your press release based on the sharing buttons located along your press release on BusinessWire.com.
- Total Shares: Total count of third-party sharing of your press release.
- Shares by Platform: Total number of shares per platform. This includes social media sites and other actions such as emailing to share your press release or copying your press release's link.
- Shares by Location: A breakdown of total shares per geographic location.
- Shares by Organization: A breakdown of total shares per company or organization that shared your press release.
Syndication and Reach
This section contains a partial list of online media hosting your press release, plus information about subscription-based email and RSS feed views.
Online Postings: Logo display and list of websites that have confirmed postings of your press release. These sites keep news releases posted for different periods of time, so some links may no longer go to your release after the posting time has elapsed. Each site logo or name links to that site in a new window.
Potential Audience: An estimated traffic total (measured by unique visitors per month) to the websites that have confirmed postings of your press release.
Subscriber Emails: The number of emails containing a headline and link to your press release sent to My News and PressPass subscribers.
- My News: Impressions based on registered MyNews users on BusinessWire.com.
- PressPass: Impressions based on registered PressPass users such as journalists, bloggers, analysts, or other content creator. Learn more about PressPass.
Views by Feed: Views sourced by RSS feeds, displayed for each RSS category where a view occurred.
Tooltips
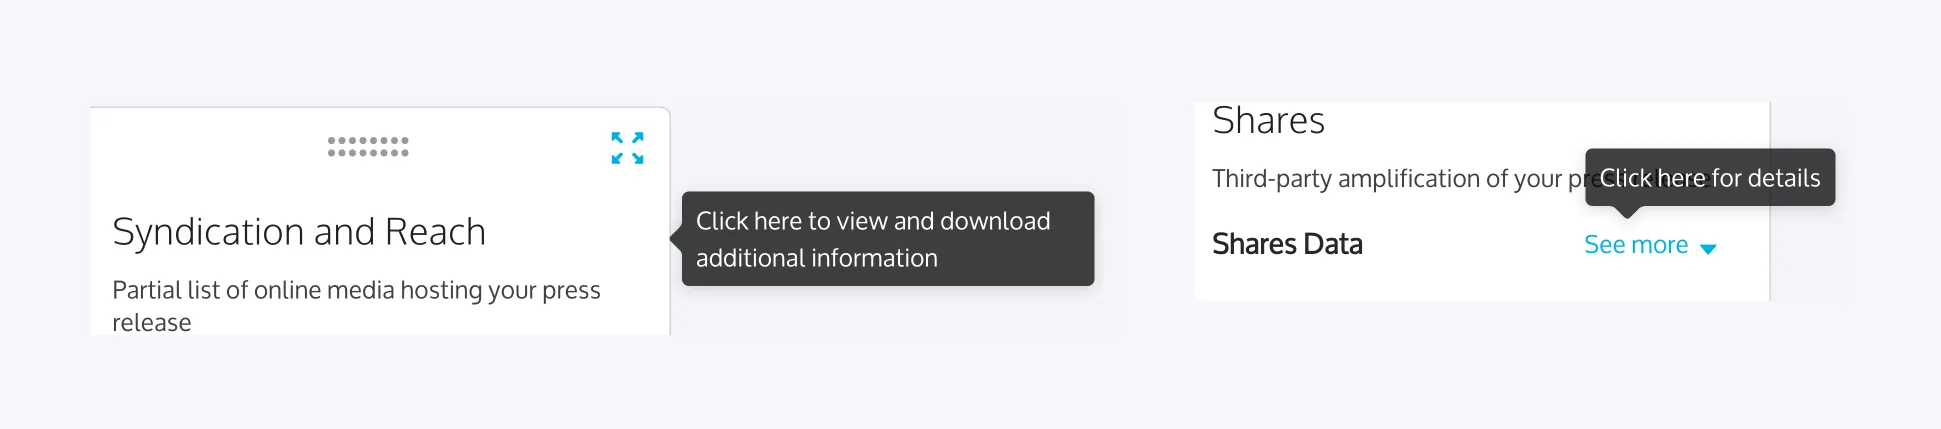
As you move your mouse around and hover over elements in a NewsTrak Report, tips appear to provide additional guidance or options available.